
Updated: January 24, 2024 - 9 min read
This month we’re focusing on all things Product Data Analytics. Keep an eye out for events, podcasts, blogs, and more!

Data is not the easiest field to master. Far from it, data science is as vast as it is complex. Luckily, as a Product Manager, no one expects you to be a full-blown data scientist. But the best Product Managers are data-driven, and there’s no doubt that the more you understand data, the easier your job in PM will be.
If you’re just starting on your data journey, there are a few key things that you absolutely have to understand. The first is the difference between quantitative and qualitative data. Because at the end of the day, all data is either qualitative or quantitative. By understanding the difference between them, and knowing some basic research methods, you’re well on your way to becoming a data-driven Product Manager.
Check out: Stand Out as a PM Using Data
Why Data Matters
You might be asking yourself ‘Do I really need to know that much about data? That’s what the Data Scientist is for?’ The answer to that is, yes, you really do need to know about data!
There are many reasons, and many ways in which data helps Product Managers on a daily basis. Just to give you a refresher, we’re going to go over the most important ones.
Data helps Product Managers to gain alignment. We tend to see data as ‘fact’, or something which can be used as an objective truth when teams are trying to make decisions. While it’s rarely that simple, it’s true that data can help to provide context. When strong opinions are flying around the room, it’s useful to have some data sets to refer to, to aid with prioritization decisions.
Data adds weight to your opinions. ‘Without data, you’re just another person with an opinion’ as W. Edwards Deming tells us. In Product Management, you have to be able to influence without authority. Data can help you do that by providing evidence for your opinions.
Data helps you make the right choices. It’s not just about looking like you know your stuff, it’s about actually knowing your stuff. There is much truth to be found in data, and using it properly can ensure that you’re building the right things for the right people in the right way. You need data to build something that people actually need, in a way that makes sense.
Data helps you discover new opportunities. If used in the right way, data can challenge your perceptions and completely change your perspective, opening doors to new opportunities.
Data ensures you’re customer-focused. When you rely on the data, you’re getting to the truth about your customers, and letting it tell you what they really need, want, value, and will be retained by.
Data helps you find your product-market fit. Good data gathering begins long before the start of the development process! When you perfect data analysis on your target marketing, and perform continuous data gathering on the market throughout development, you ensure that what your building has a place in the market.
Find out why product-market fit is so vital for product success.
So now you’re fully aware of the myriad advantages that data can bring, and you’re ready to begin your journey to becoming data-driven.
The first thing you need to understand is that all data is one of two things…qualitative or quantitative.
What Is Qualitative Data?
Qualitative data, also sometimes known as soft data, involves information that can’t be boiled down so easily to numerical data.
Typical qualitative data sources might include:
App/Play store reviews
Press and PR
Interview transcripts
Beta tester feedback
Survey and interview questions
Customer service feedback
Qualitative data is useful because it captures things that the numbers can’t tell you, and fills in some vital gaps.
It’s usually very loosely structured, and you’re unlikely to find a spreadsheet comprised fully of qualitative data. Typical qualitative data visualizations include word clouds and mood boards.
This type of data can also help you to form customer problem statements, as you can take words straight from the horse’s mouth. If you notice that various customers use the word ‘complicated’ to describe a process they’re having problems with, use that to form your problem statement. This keeps your problem statements directly related to what’s relevant to the customer, and not to you.
Analyzing qualitative data sounds difficult, but it adds a lot of value to your data sets, and helps you to remember that you’re building products for people and not for robots.
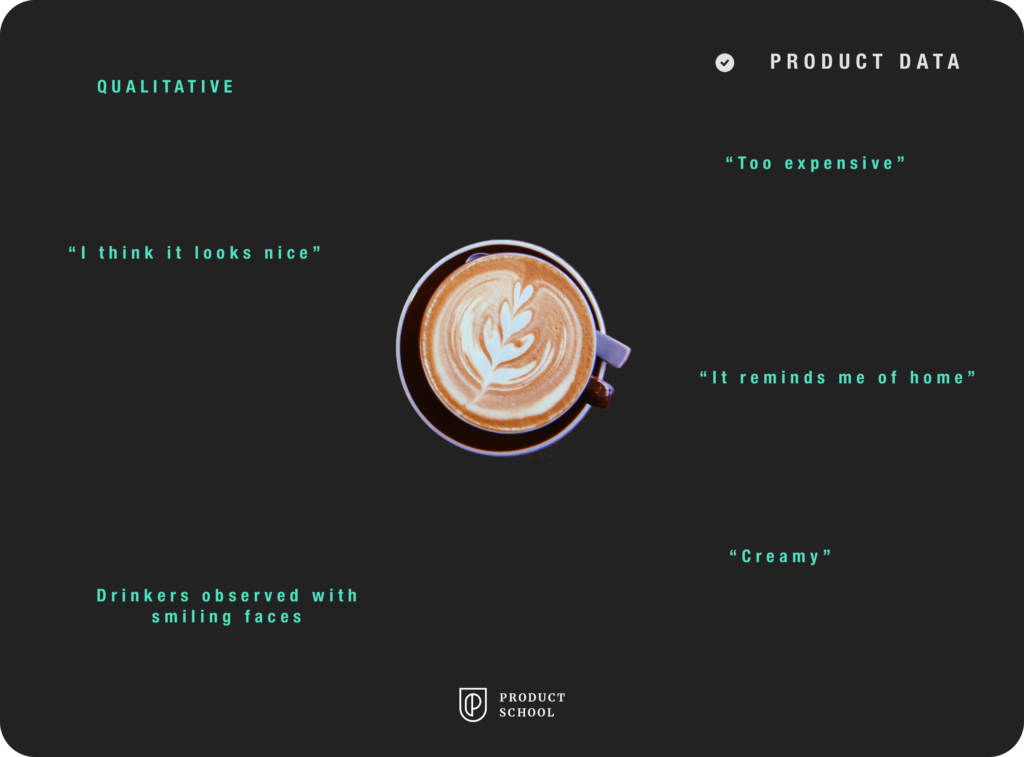
Imagine that you’re trying to invent the perfect cup of coffee, and so you set up a focus group in your local coffee shop. The qualitative feedback you gather might look something like this:
Common Qualitative Research Methods
Let’s go over some of the most common qualitative methods for data collection.
Interviews
Interviews allow you to get up close and personal with your target (or existing) users. It adds the human element to your user research. You can take the time to find out more about their problems and the challenges they face around it, and find out their reaction to your products.
Focus Groups
Focus groups give you an opportunity to speak to your target or existing users in a more time-effective way, as one to one interviews are more time intensive. You can place a beta version of your product right into your users' hands, and see how they interact with it. It can also be a useful exercise to see how people talk about the product when with other users, as when talking to the development team they may be telling you what they think you want to hear.
You can also plan a particular activity, like card-sorting. You could also take the opportunity to run an A/B test, giving one focus group version A of the product and another group version B.
Surveys
Surveys can provide you with a decent mix of qualitative and quantitative data if structured accordingly. By asking open ended questions, and allowing users to elaborate, you can gather some key qualitative data. Don’t just ask, ‘do you like the product?’ Instead ask, ‘how does the product make you feel?’ ‘What would you improve about X or Y?’
Surveys are also popular with product teams, as you can gather a large amount of data without having to put in too much effort. Face to face interviews and focus groups take up quite a significant amount of time and resources, whereas a survey can be sent out to as many customers as you need, and collects data with little effort on your part.
Check out: 6 Things Product Managers Can Do With Qualitative Research
What Is Quantitative Data?
Quantitative data, also known as hard data, is comprised of more traditional types of data, usually expressed in numeric values.
Quantitative data is the answer to closed-ended questions, and might involve data collection methods such as:
Usage reports
Market research
Metrics
Surveys
Quantitative data is relied on the most by product teams, because it is seen as more reliable, and closer to the objective truth. While many different interpretations can be made of the same qualitative data set, you’ll generally find gaining alignment on quantitative data easier. For example, if 99% of users who tried a new feature used it properly and achieved their goal, you can safely say the feature is easy to use, or is at least well designed.
Whereas your whole team could read the same 3-star review on the App store and come away with a slightly different interpretation.
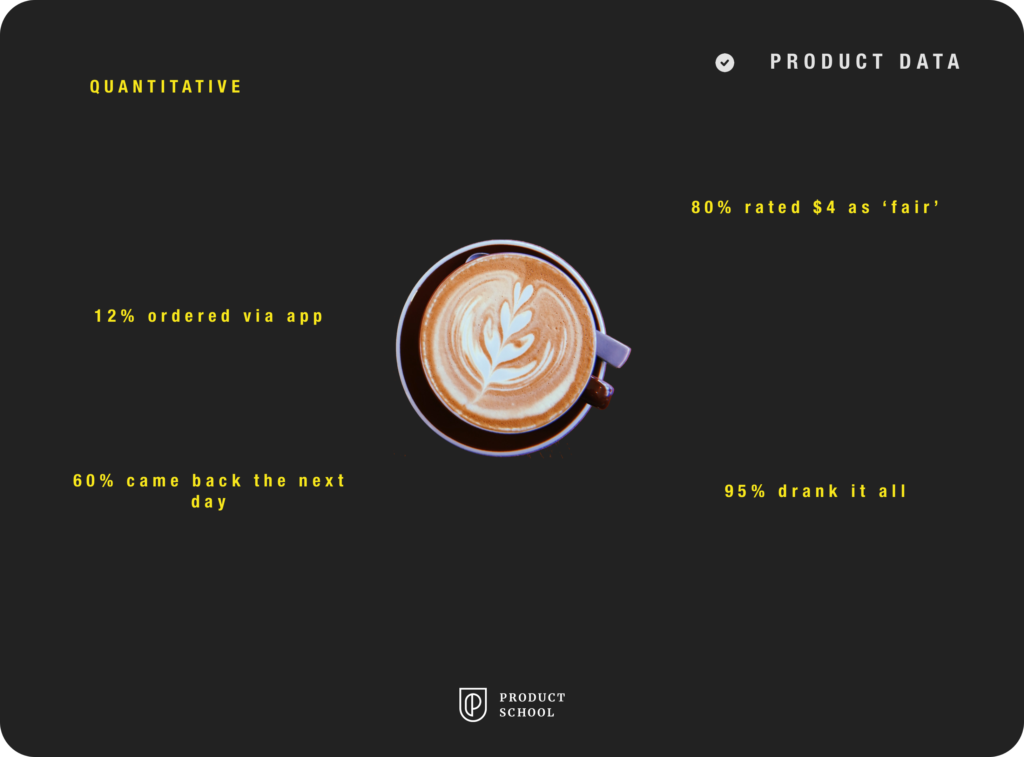
Let’s go back to our experiment in the coffee shop. The quantitative data which you collect from the same focus group might look something like this:
The Different Types of Quantitative Data
Quantitative data can be broken down into two different types:
Discrete data. Anything that you can count rather than measure, and is finite. For example, the number of daily active users you have, the number of people who check out vs the number of people who abandon cart, etc. With discrete data, the numbers normally can’t be broken down into smaller parts. (You can’t really have 0.25 of a user!)
Continuous data. This is data that constantly changes, fluctuating between two presumed points. For example, the time it takes to download something from your website, your age, or the amount of oxygen in your blood. This data can be broken down into smaller parts, as accuracy in continuous data sets is absolutely critical in professions like medicine.
How to Use Both, And Why You Need To
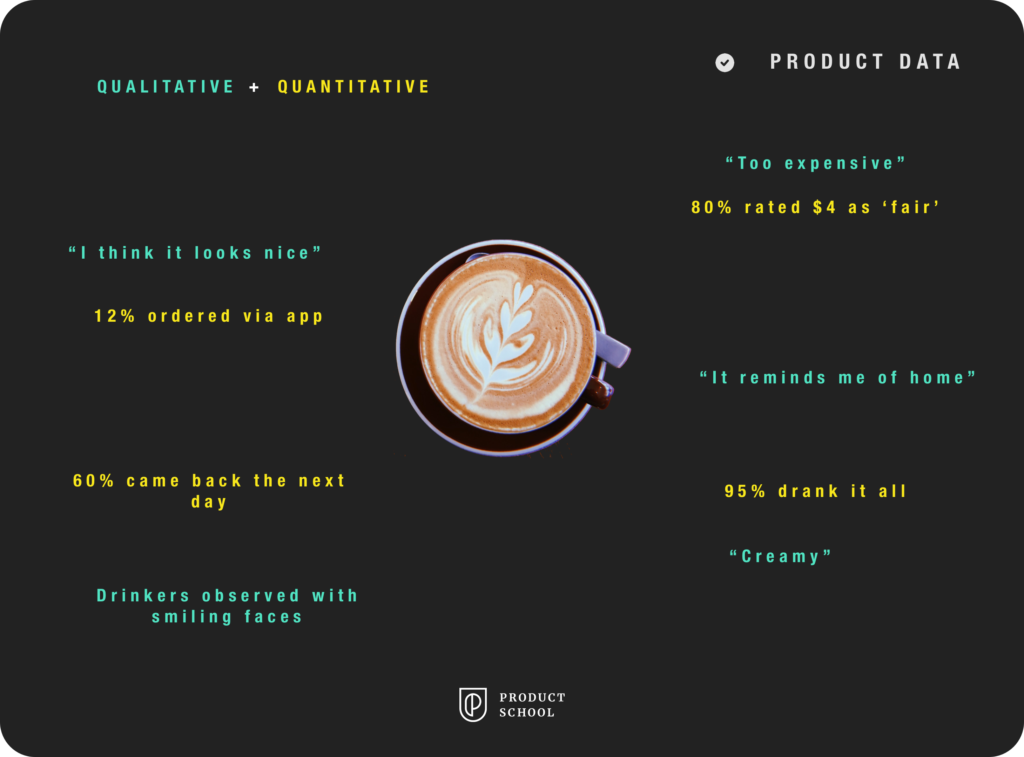
Let’s finish off with our coffee shop experiment. When you bring the soft and hard data together, then you can start making the right assumptions and getting the right insights:
Both quantitative and qualitative research is vital for fully fleshed out ideation. You to build something which both solves a problem, and feels good to use.
Smart data-driven Product Managers don’t just use these data sets in isolation, they use them to complement each other. Use quantitative data to verify or challenge what users are telling you in reviews and interviews.
Many modern BIs and Data Visualization platforms give you new ways to store, collect, and analyze your qualitative data. Qualitative data will also be incredibly helpful to teams such as marketing and PR, and your UX Designers will be able to use it to craft the perfect user personas.
Qualitative data is often seen as less important, but the truth is that it gives you the voice of your customers. Using it alongside your quantitative data gives you a broader perspective and a more complete understanding of your customers, the market, and your product.
Are you ready to dive in and learn more about Data? Check out our free Data Analytics Certification!
Updated: January 24, 2024