To KPI or to OKR? That is the question.
Actually, it's not the question. The great OKR vs. KPI debate ends now! As you'll see below, both OKRs and KPIs are essential in Product Management. In this article, we'll explain what OKRs and KPIs are, the difference between OKRs and KPIs, and touch on the Product Management metrics both frameworks rely on.
We'll also cover how to establish an OKR vs. a KPI, common mistakes and best practices for both, and examples of how to leverage KPIs and OKRs in Product Management scenarios.
Enroll in Product School's Product Strategy Micro-Certification (PSC)™️
The difference between a good and a great product lies in your Product Strategy, answering vital questions like: Who's the product for? What benefits does it offer? How does it further company objectives?
Enroll for Free
What are OKRs and KPIs?
Before we get any further, let’s define OKRs and KPIs.
OKR definition
Being outcome-focused helps you become more customer-focused.
— Ajay Swamy, Product Leader at Amazon, in Measuring What Matters in Your Product.
Objectives and Key Results (OKRs) are a goal-setting framework that helps teams align operational actions to big-picture objectives. OKR stands for Objectives and Key Results. Used by Google, Spotify, Airbnb, Twitter, and LinkedIn, the OKR framework has been tried and tested by the best!

The OKR framework is split into 1) Objectives, 2) Key Results, and 3) Initiatives.
Objectives: the outcomes, often qualitative, that you hope to achieve. They answer this question: What value are you driving for the business or users?
Key Results: quantitative metrics that show the progress you’re making toward your Objectives. Focus on up to 5 KRs per Objective. They connect the operational actions your team takes on the day-to-day to measurable end results.
Initiatives: projects and tasks that help you achieve a Key Result. They didn’t make it into the “OKR” acronym, but they’re still vital to this framework!
KPI definition
KPIs stand for Key Performance Indicators. Used widely across various industries, KPIs provide critical insights into business health and operational effectiveness.
Key: the most important or critical aspects of performance that significantly impact business goals and overall success.
Performance: the activities, actions, and processes that are measured to assess how well an organization or individual is achieving its goals.
Indicator: A specific metric used to track and evaluate performance.

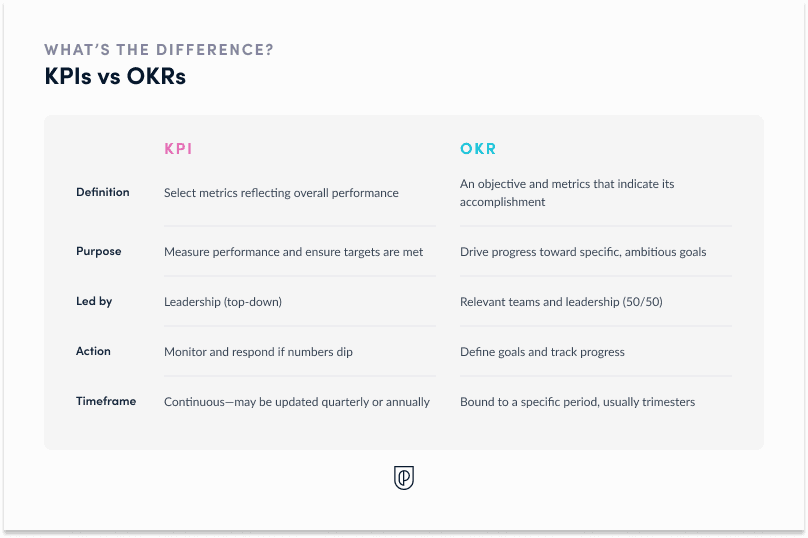
KPIs vs. OKRs
Objectives and Key Results (OKRs) and Key Performance Indicators (KPIs) leverage the same metrics. The difference is in how, when, and why. In essence, OKRs are focused on an objective in the near term, whereas KPIs are constant signals of the health of the business.
Every time you get a physical, your doctor tracks your weight, heart rate, and blood pressure. These “vital signs” are KPIs. They are key indicators of your overall health. No matter what’s going on that day, your doctor will track your vitals.
Now, let’s say your doctor wants you to improve your cardiovascular health to lower your risk of diabetes. That’s an objective. The key results might be as follows:
Lose 8 pounds by the end of summer
Reduce BMI by 2 points in the next 6 months
Achieve a blood pressure reading of less than 125/85 mmHg within the next 8 months
Reduce LDL cholesterol to less than 120 mg/dL and increase HDL cholesterol to more than 50 mg/dL within the next 12 months
Notice that weight and blood pressure are both KPIs and Key Results (KRs). A KR is a KPI that is tied to a specific, time-boxed objective.
KPIs tell you where you are, whereas OKRs tell you where you want to be. KPIs are the metrics that a company pays special attention to month in and month out, quarter after quarter. OKRs, on the other hand, are focused on a certain goal, progress toward which is measured by specific Key Results.
Metric vs. KPI vs. KR
Metrics are anything that you can measure. Some examples of common metrics used in Product Management include:
Net Promoter Score (NPS)
Monthly Active Users (MAU)
Churn or Customer Retention Rate (CRR)
Session duration
Customer Acquisition Cost (CAC)
Time to First Value (TTFV)
Not every metric has the same value. Depending on a company’s mission or the vision for the product, different metrics will be much more important than others. For instance, churn for a product like Bumble might not be a bad thing—it could mean people met someone and stopped using the app, i.e. that the product is working perfectly!
With this in mind, most companies set KPIs to keep everyone focused on the numbers that matter most. KPIs are the metrics that matter most based on the mission, business model, and product vision. A KPI for a product like Netflix might be session duration because it indicates the level of user engagement and the effectiveness of Netflix’s content strategy.
KPIs can become KRs when they are tied to a specific objective. If Netflix wants to increase user engagement with original content, then a key result might be to boost average viewing hours per user by 15% for original content within the next two quarters.
In sum, all KPIs are metrics, and KRs are KPIs that support specific objectives.

Establishing OKRs and KPIs: Common Mistakes and Examples of Best Practices
Establishing OKRs
Brainstorm objectives. Objectives should be aligned with company strategy and high-level goals. They’re usually ambitious.
Ask yourself: Why should we prioritize this objective?
Narrow the list down to 3-5 objectives
Key results: For each of the 3-5 objectives selected above, set up to 5 KRs. Make sure they are:
Measurable
Achievable
Aligned with the objective
Initiatives: Initiatives are projects and tasks that help you achieve a Key Result. Each KR can have 1-5 associated initiatives. Some initiatives may apply to more than one KR.
For each product OKR, create an OKR statement:
Objective #1: I will (Objective) as measured by (Key Results).
Objective #2: I will (Objective) as measured by (Key Results).
Common OKR mistakes and best practices to avoid them
Mistake | Best Practice | Example |
|---|---|---|
Inconsistent scoring framework | Pick the best framework for your needs and stick with it. Make sure everyone understands the framework, and what success looks like | There are many possible scoring frameworks. We recommend a simple scoring system called GYOR (Green, Yellow, Orange, Red): Green: 100% of key results achieved Yellow: >= 70% of key results achieved Orange: >= 50% and < 70% of key results achieved Red: < 50% of key results achieved |
Setting and forgetting your OKRs. Don’t do all that work for nothing! | Your OKRs are only as valuable as your ability to use them to influence your team’s day-to-day work. Provide weekly updates on your OKRs to keep them top of mind | Include the following in your OKR updates: - % of progress made towards each key result - Confidence of completing each key result by the end of quarter (Completed, High confidence, Medium confidence, Low confidence, Not on track) - Key updates: notable progress made, exceptional circumstances, and roadblocks |
Setting vanity metrics | Connect your OKRs to your Product’s North Star to make sure there is a purpose behind your goals | Basecamp’s Product North Star: make project management more of a joy and less of a chore. When creating a progress tracking feature, your team might think about ways to increase simplicity, ease of use, and delighters |
Measuring outputs or feature completions instead of outcomes | Outcomes > output! This helps keep you focused on what you really want to achieve. | Stop thinking: We succeeded because we launched 3 new features. Start thinking: We succeeded because we reduced customer churn by 5%. |
Seeing OKRs as a top-down activity with no input from their individual contributors | Setting OKRs is a collaborative process | Your data analyst and UX researcher share with you key touchpoints, helping you target critical moments and set realistic goals |
Product Teams not aligning their OKRs with other teams | Communicate and collaborate! | You want to work with your User Research Team to interview at least 10 customers who might churn within the next 6 months. Ensure the UX research team has an OKR to support any user research needed) |
Taking a goals-first approach instead of a roadmap-first approach | Step back before setting your Outcomes. Look at company OKRs and align your Product OKRs with these | Your Product Team sets a goal to reduce customer churn. BUT company goals deprioritize churn reduction in that they want to improve the product experience not for specific users, but for a specific kind of user |
Conflating Key Results and Initiatives | Connect Key Results to a metric instead of to an action | Objective: Get in shape Key Result: Decrease body fat by 5% Initiative 1: Run 5 miles a week Initiative 2: Eat healthy If I run 5 miles every week but have McDonald's for breakfast, lunch, and dinner, I won't achieve my objective. Having multiple initiatives that chip away at a Key Result helps you cover all your bases. |
Setting KPIs
Identify Key Business Objectives
Understand and align with the overarching business goals and strategies.
Ask yourself: What are the critical success factors for our organization?
Determine Success Indicators
Define what success looks like for each objective.
Identify specific metrics that accurately reflect progress towards these goals.
Ensure these metrics are quantifiable and relevant.
Incorporate a North Star Metric
Identify a single, overarching metric that best captures the core value your product or service delivers to customers.
Ensure this North Star metric aligns with long-term business success and guides strategic decision-making.
Use this metric to focus and align the efforts of all teams towards a common goal.
Common KPI mistakes and examples of how to avoid them
Mistake | Best practice | Example |
|---|---|---|
Measuring too many metrics | Select a few critical KPIs that directly impact business performance | Limit your KPIs to 5-7 key metrics that align closely with your strategic goals. This maintains focus and makes it easier to manage and act upon them effectively. |
Overlooking North Star metrics | Identify and focus on your North Star metric to guide strategic decisions | Identify and focus on your North Star metric to guide strategic decisions |
Ignoring external factors | Consider external benchmarks and industry standards when setting KPIs | If the industry average customer churn rate is 10%, setting a KPI to maintain a churn rate below 8% gives a competitive edge. This ensures your KPIs are realistic and competitive. |
Lack of accountability and ownership | Assign clear ownership for each KPI to ensure accountability | Designate specific team members or departments responsible for each KPI. For example, the marketing team could own the KPI for lead generation, ensuring there is accountability for performance. |
Overlooking the need for data quality and accuracy | Ensure data used for KPIs is accurate, reliable, and timely | Implement data validation and regular audits to maintain the quality of data. Accurate data ensures KPIs are trustworthy and decisions based on them are sound. |
Setting KPIs without stakeholder buy-in | Engage teams in setting KPIs that impact their work. | For example, involving the sales team in setting targets for customer acquisition ensures they are realistic and have buy-in from those responsible for achieving them |
Not using visual tools for tracking KPIs | Utilize dashboards and visual tools to track and communicate KPI progress | Use KPI dashboards to provide real-time visibility into performance. Tools like Tableau or Power BI can help visualize KPI data, making it easier for teams to understand and act upon it. |
Not aligning KPIs with product team goals | Ensure product team KPIs align with overall business objectives and user needs | If the business goal is to enhance user engagement, a product team KPI might be the number of daily active users. This ensures the product team’s efforts contribute directly to the company’s strategic goals. |
OKR vs. KPI in Product Management: Examples
In Product Management, you need both KPIs and OKRs. Successful Product Teams know when to use which and how to use them effectively. Let’s clarify further with some more examples from Product Management and identify the KPIs and OKRs in different scenarios.
Personalized Playlists at Spotify: Protecting market share with increased product offerings
The personalized playlist is one of Spotify’s most important USPs. They broke through the musical noise with a disruptive algorithm that helped people discover the music they didn’t even know they loved. Because of this product’s importance, Spotify executives keep a close eye on the personalized playlist’s performance with specific KPIs.
Personalized Playlist KPIs for Spotify
Playlist Save Rate: The percentage of users who save personalized playlists to their library.
User Interaction Rate: The frequency of user interactions (likes, shares, comments) with personalized playlists.
Playlist Completion Rate: The percentage of users who listen to the entire personalized playlist.
Repeat Listening Rate: The percentage of users who listen to the same personalized playlist more than once.
Playlist Conversion Rate: The percentage of users who upgrade to premium subscriptions after engaging with personalized playlists.
With time, other competitors have developed similar offerings. Let’s imagine that over the last quarter, executives at Spotify have become concerned about user engagement with personalized playlists because Playlist Completion Rate and Repeat Listening Rates are flagging. This is when OKRs come in.
OKRs for Increasing Engagement with Personalized Playlists
To address the problem, they brainstorm and land on the following OKRs:
Objective: Enhance the quality and relevance of personalized playlists to increase user engagement and satisfaction.
Key Results:
Key Result: Improve Playlist Completion Rate by 25% within the next quarter.
Key Result: Increase Repeat Listening Rate by 20% within the next quarter.
Initiatives:
Initiative: Conduct user surveys and focus groups to gather feedback on playlist content and discover common reasons for not completing playlists.
Initiative: Implement advanced machine learning algorithms to better tailor playlist recommendations based on user preferences and listening history.
Initiative: Collaborate with popular artists to create exclusive content and themed playlists that attract and retain user interest.
Initiative: Enhance the user interface to make it easier for users to find, save, and revisit their favorite personalized playlists.
Initiative: Introduce interactive elements like user ratings and comments on playlists to better understand user preferences and improve content curation.
Product OKR Template
Use this Product OKR template to set and track your OKRs (Objectives and Key Results). Align your team’s daily tasks with product and company strategy!
get free template
Order Value at Amazon: Seizing Opportunity
At Amazon, customer purchasing patterns are essential to understand threats and opportunities to the e-commerce giant’s business health. Analysts and executives alike watch the following KPIs to see where there might be potential to increase the average order value:
Customer purchase process KPIs:
Average Order Value (AOV): Measures the average amount spent by customers per order.
Cross-Sell and Upsell Rates: Tracks the frequency and success rate of additional items sold alongside primary purchases.
Cart Abandonment Rate: Monitors the percentage of shopping carts abandoned before purchase completion.
Analysts noticed that the AOV had plateaued over several quarters, suggesting there was a potential to increase revenue per transaction without necessarily increasing the number of transactions. Furthermore, the rates of cross-selling and upselling were lower than industry benchmarks. This indicated that customers were not frequently adding recommended items to their carts, representing a missed opportunity to boost order values. Lastly, the cart abandonment rate up since the last major platform update, suggesting friction in the checkout process or insufficient incentives for customers to complete their purchases.
Brainstorming sessions between Product, Platform, and Stakeholders landed on the following OKRs:
Objective: Increase the Average Order Value (AOV) on the Amazon e-commerce platform as measured by increased AOV, improved cross-selling, and reduced cart abandonment.
Key Result 1: Increase AOV by 15% within the next two quarters.
Initiative: Implement targeted cross-sell and upsell recommendations on product pages and during the checkout process.
Initiative: Offer bundled deals and discounts for purchasing multiple related items.
Initiative: Introduce a loyalty program that rewards customers for higher-value purchases.
Key Result 2: Improve Cross-Sell and Upsell Rates by 20%.
Initiative: Use machine learning algorithms to analyze purchase history and suggest relevant products.
Initiative: Create personalized email campaigns highlighting complementary products based on previous purchases.
Initiative: Train customer service representatives to recommend additional products during customer interactions.
Key Result 3: Reduce Cart Abandonment Rate by 10%.
Initiative: Simplify the checkout process by reducing the number of steps required to complete a purchase.
Initiative: Introduce exit-intent pop-ups offering discounts or incentives to complete the purchase.
Initiative: Implement a follow-up email campaign to remind customers of abandoned carts and offer limited-time discounts.
Benefits of OKRs
They’re agile: Setting goals every quarter instead of every year allows companies to adapt quickly, and gives them an opportunity to re-evaluate.
They provide clarity and cohesion: OKRs are visible to everyone at every level in the company, which provides transparency within the organization and makes sure everyone knows what direction the company is heading in.
They’re easy to understand: OKRs don’t have snappy language because they’re trying to be cool. Easy, colloquial language keeps things simple. By avoiding jargon anyone can understand what they mean.
They’re inspiring and ambitious: OKRs help to encourage and inspire teams to be their best. Sometimes referred to as ‘stretch goals’, Google expects their teams to reach 70% of their objectives.
They’re bottom-down AND top-up: Individuals get involved with goal-setting, as around 50-60% of a company’s OKRs are set by teams. This gets everyone more involved in the process and helps create a better understanding of the overall company strategy.
Product OKR Template
Use this Product OKR template to set and track your OKRs (Objectives and Key Results). Align your team’s daily tasks with product and company strategy!
get free templateUpdated: November 6, 2024