A prioritization matrix is a decision-making tool product managers use to rank features, tasks, or initiatives against clear criteria, value and effort, impact and feasibility, or urgency and importance. It turns messy product trade-offs into a visual grid so teams can see what matters most, what can wait, and what should not be built at all.
For AI PMs, the clarity that they get from product prioritization is important. Every roadmap has more ideas than capacity. Sales wants one thing, and engineering flags another. Customers ask for five more. Leadership wants growth…
This guide breaks down how prioritization matrices work in product management. We compare six useful frameworks, walk through a scored example with real numbers, and give you a free template you can use to prioritize your own product work.
Who This Is For
This guide is for product managers who need a more structured way to decide what gets built next.
It is useful whether you are an associate PM learning how to judge backlog items, a mid-level PM trying to make sprint and release trade-offs, a senior PM defending roadmap calls, or a head of product helping multiple teams prioritize with the same logic.
If you need to rank features, compare initiatives, scope an MVP, explain why something did not make the roadmap, or bring more discipline to messy prioritization conversations, this guide is for you.
Feature Prioritization Template
Use this feature prioritization template to get clear direction on which features to include and which to leave out.
Download Free
TL;DR: Prioritization Matrix
The main benefit is clarity. Instead of debating opinions, teams can compare roadmap items using a shared scoring system.
Product managers use prioritization matrices during sprint planning, backlog grooming, roadmap reviews, stakeholder conversations, and release planning.
The best framework depends on the decision. Use Value vs. Effort for quick wins, RICE for data-backed backlog scoring, MoSCoW for MVP scope, Kano for customer satisfaction, and Weighted Scoring for complex cross-functional decisions.
A prioritization matrix works best when the team scores together. PMs should include engineering, design, data, customer-facing teams, and relevant stakeholders before making final calls.
Scores should guide decisions, not replace judgment. Effort estimates change, customer needs shift, and strategic bets sometimes deserve priority even when the matrix looks less obvious.
AI can help PMs maintain prioritization matrices by clustering duplicate requests, summarizing customer feedback, checking new ideas against existing criteria, and flagging priorities that have changed over time.
The output should be a clearer roadmap, not a prettier spreadsheet. Good prioritization shows what to build now, what to delay, what to validate, and what to remove from the plan.
What Is a Prioritization Matrix?
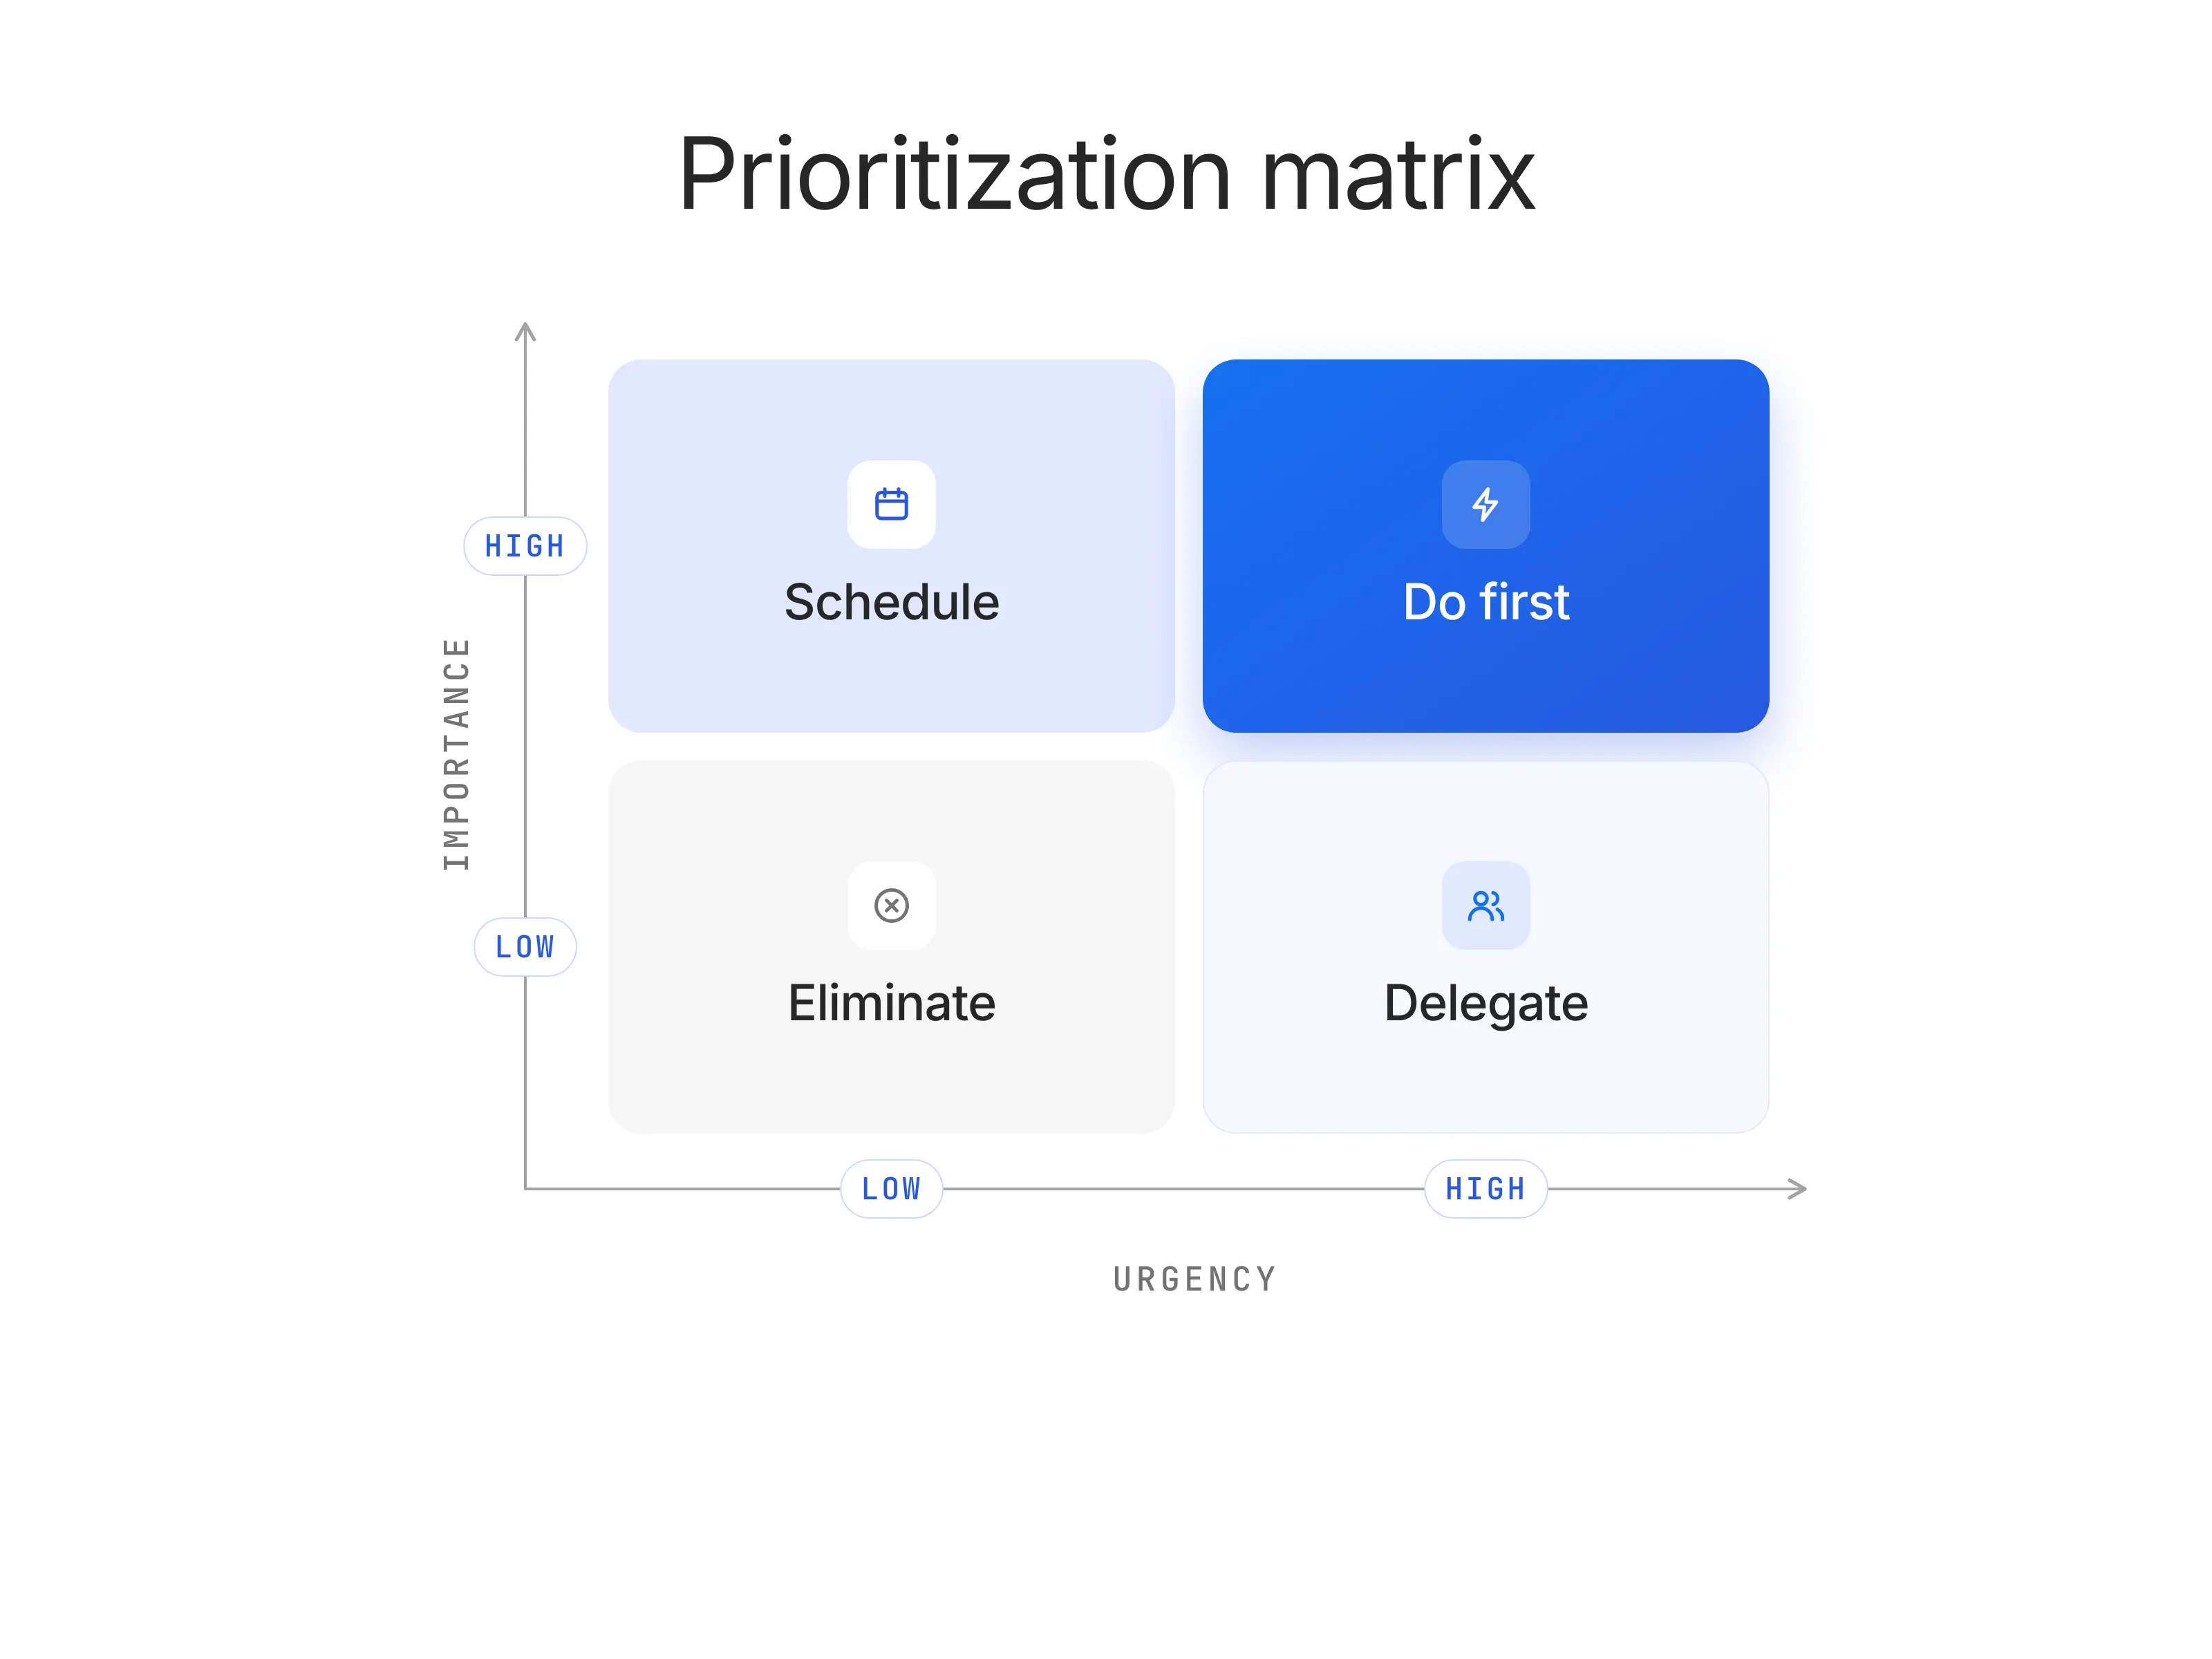
A prioritization matrix is a decision-making tool that helps you determine what tasks, projects, or features deserve your attention based on their importance and urgency. It’s essentially a structured way to organize chaos, especially when you’re juggling competing priorities.
Think of it as your compass when everything feels like a top priority.
In product management, the prioritization chart often comes to the rescue when deciding which features to build next. It evaluates items against specific criteria — typically importance and urgency — and categorizes them into four quadrants:
Do First (high importance, high urgency)
Schedule (high importance, low urgency)
Delegate (low importance, high urgency)
Eliminate or Deprioritize (low importance, low urgency)
The prioritization matrix goes beyond personal productivity, however. It’s a way to align efforts with company goals, user needs, and timelines, ensuring that resources are invested in the tasks that bring the most value.
By visualizing priorities, it reduces ambiguity, streamlines decision-making, and helps teams avoid common pitfalls like feature creep or analysis paralysis.
Simple Prioritization Matrix Example: How It Works in IT and Product Management
Let’s say you’re managing a task management app, and your team needs to decide between four potential features to develop next:
Feature 1: Calendar integration
Feature 2: Custom themes
Feature 3: AI-powered task suggestions
Feature 4: Offline mode
To prioritize effectively, you use a prioritization matrix:
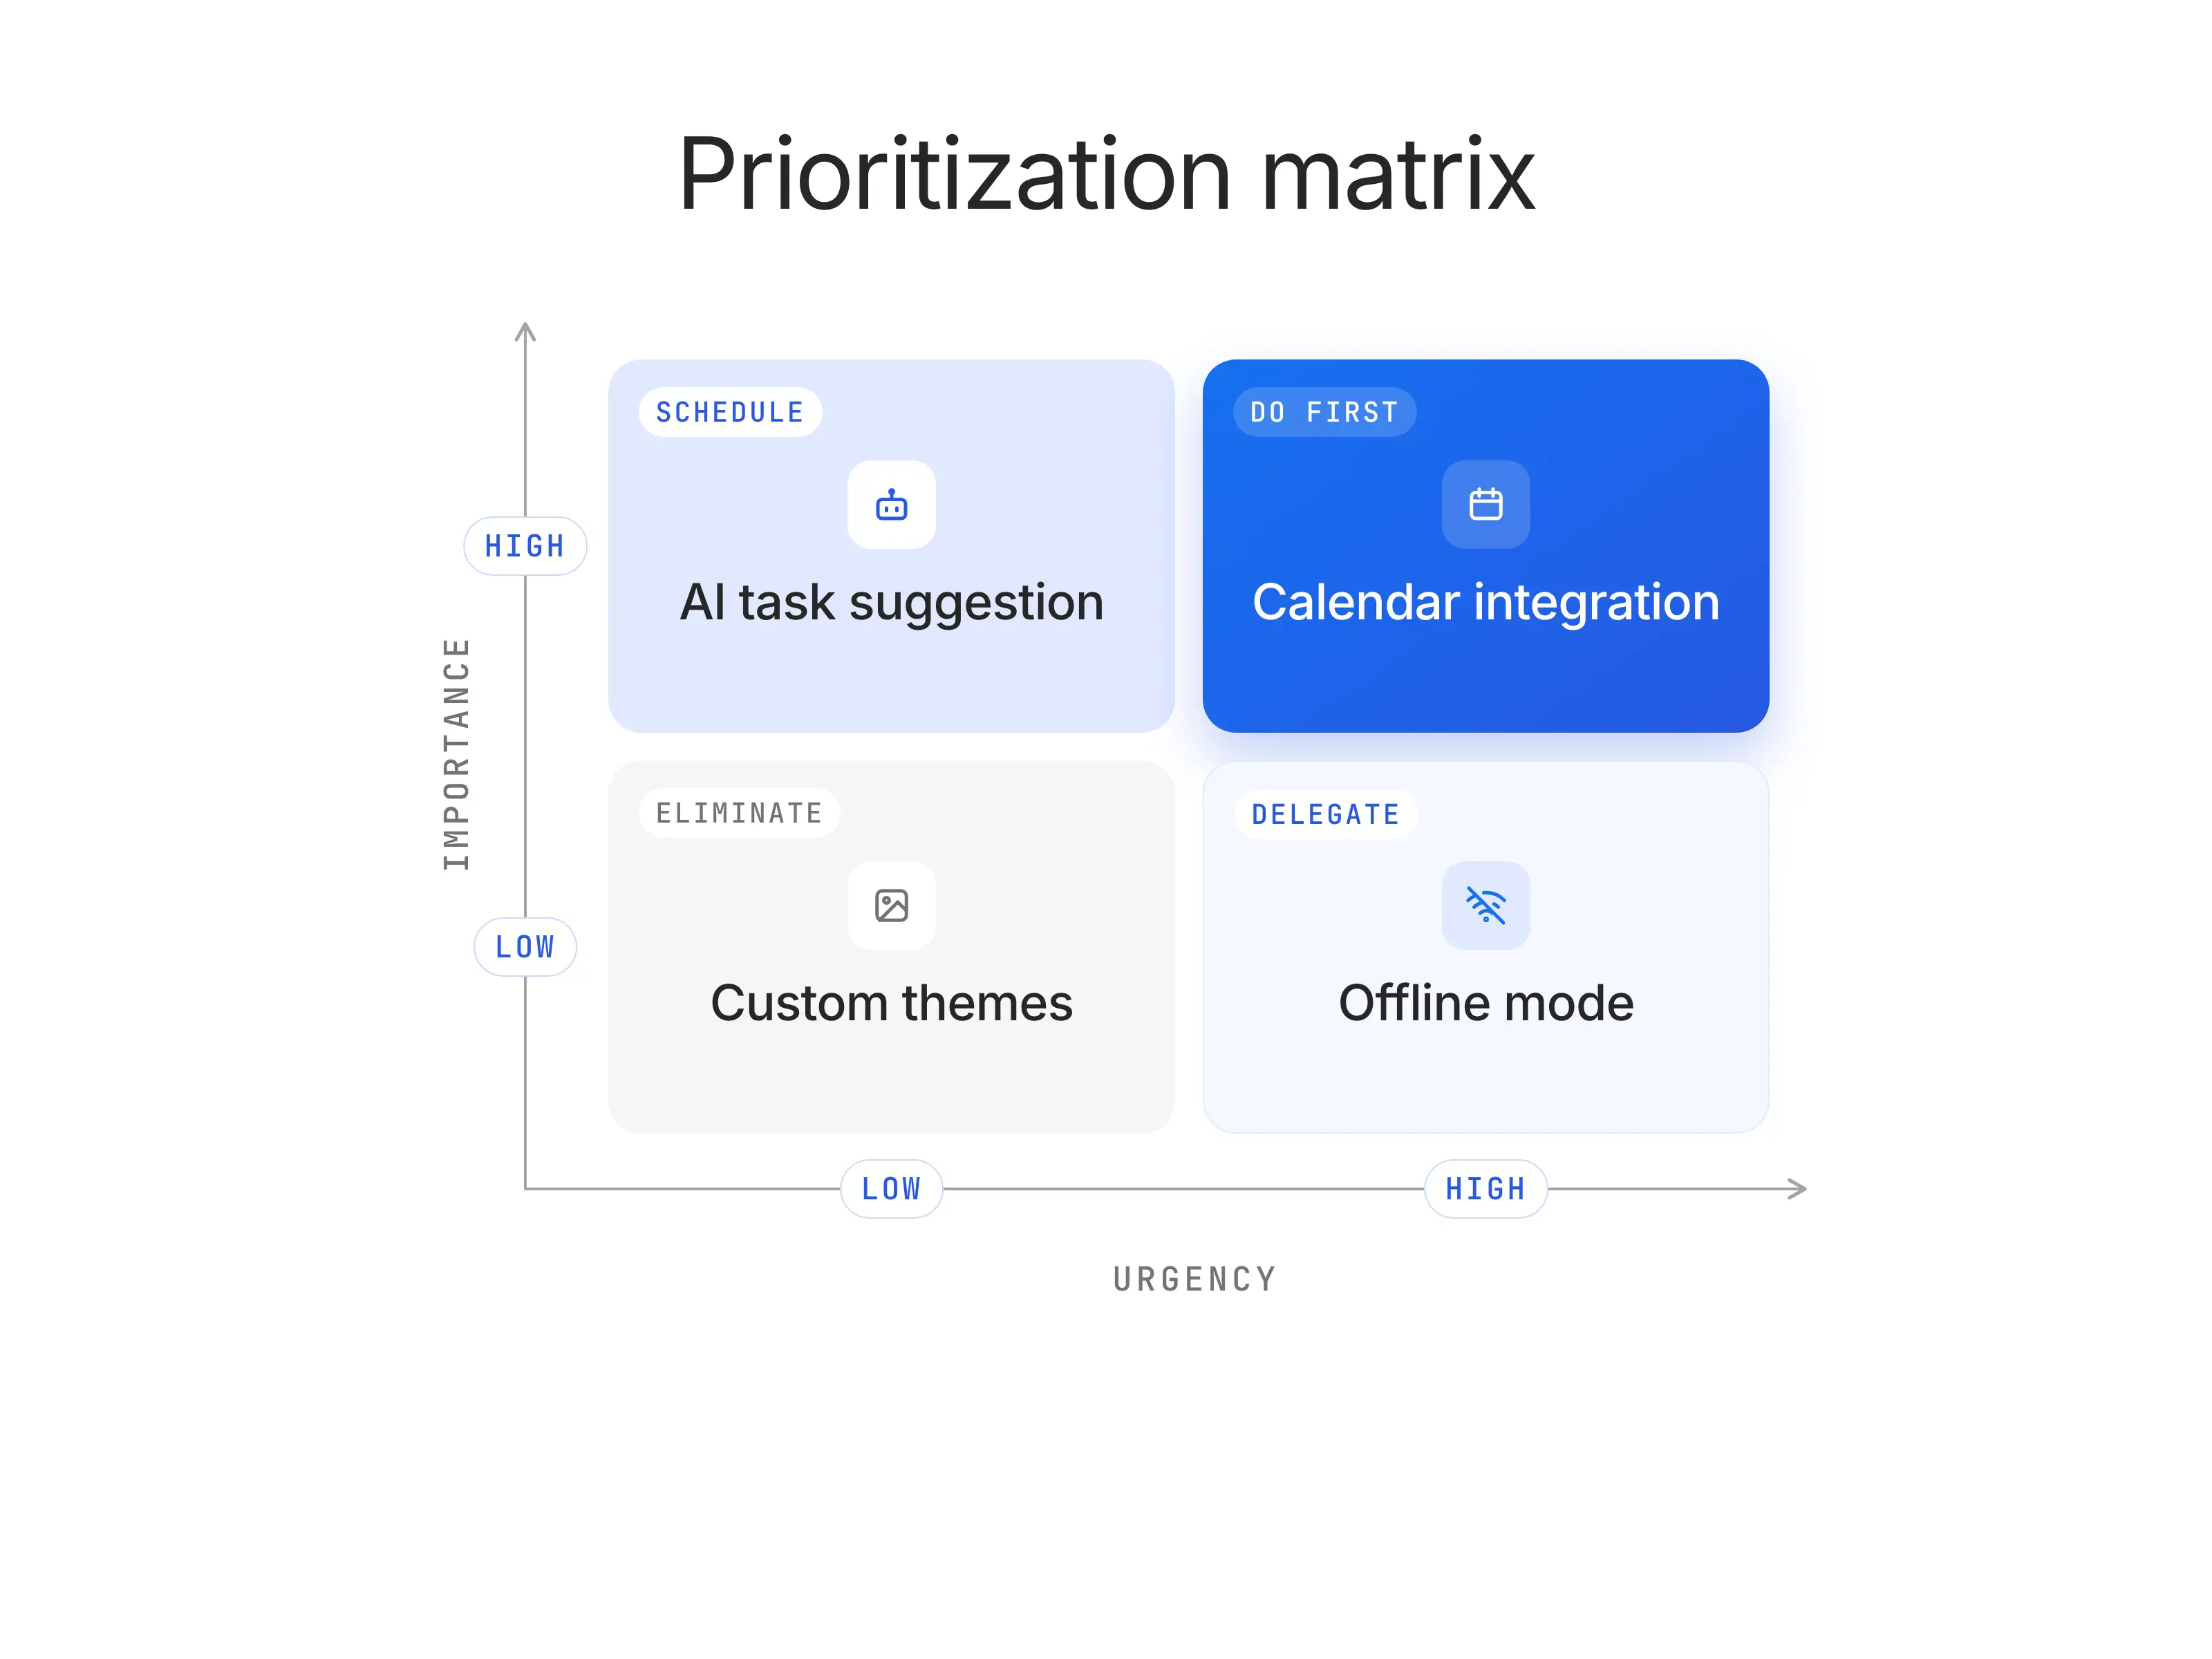
For calendar integration, you rank it as high importance (it meets a key user demand) and high urgency (it has multiple dependencies, including AI-powered task suggestions). This lands it in the “Do First” quadrant in order to avoid bottlenecks.
For custom themes, you rank it as low urgency and low importance (it’s a nice-to-have but not essential), placing it in the “Eliminate or Deprioritize” quadrant.
For AI-powered task suggestions, you determine its high importance (it aligns with long-term product differentiation) but low urgency (it’s not critical to your short-term goals), so it goes in the “Schedule” quadrant.
For offline mode, you find it’s low importance (not many users need it) but high urgency (a direct competitor recently made its product available offline, and you can’t risk losing users due to a minor functionality) ), so it falls in the “Delegate” quadrant—perhaps for a smaller team to handle.
Why Product Managers Use a Prioritization Matrix
Product managers use a prioritization matrix because every product decision has a cost. Choosing one feature usually means delaying another, using engineering capacity, spending design time, and asking the business to wait for something else. A matrix gives PMs a structured way to compare options instead of relying on opinion, seniority, or whoever argues the loudest.
In sprint planning, a prioritization matrix helps the team separate urgent work from valuable work. A bug affecting 40% of active users should not sit next to a cosmetic UI request in the same backlog lane. By scoring work against impact and effort, PMs can guide the team toward the items that create the most value inside the next sprint window.
In stakeholder alignment, the matrix creates a shared language for trade-offs. Sales may want a feature for one large prospect. Customer success may push for usability fixes. Leadership may care about revenue impact. Engineering may raise technical risk. A prioritization matrix puts those inputs into the same decision system.
In roadmap reviews, a prioritization matrix gives product managers a defensible answer when executives ask why one initiative made the product roadmap and another did not. Doing this, the PM can show the scoring logic: customer reach, business impact, confidence, effort, risk, or strategic fit. That makes roadmap decisions easier to explain and harder to derail.
In resource allocation, the matrix helps PMs protect limited team capacity. If a feature has high value but requires three months of backend work, it may need to wait behind a smaller improvement that unlocks immediate retention, activation, or revenue gains. The goal is to make better choices when the team cannot build everything at once.
6 Essential Prioritization Frameworks Compared
No prioritization framework works for every product decision. The right choice depends on what you’re deciding, how much data you have, how many teams are involved, and how much precision the decision needs.
Framework | Axes / Criteria | Best for | Complexity | When to avoid |
Eisenhower Matrix | Urgency vs. importance | Personal task management, triage, operational prioritization | Low | Feature-level product decisions that need scoring or trade-off math |
Value vs. Effort Matrix | Business/user value vs. development effort | Quick-win identification, sprint planning, backlog grooming | Low–Medium | Long-term strategic bets where near-term effort does not reflect true value |
RICE | Reach, Impact, Confidence, Effort | Backlogs with quantifiable reach and available product data | Medium | Early-stage products with little usage data or weak confidence estimates |
MoSCoW | Must have, Should have, Could have, Won’t have | MVP scoping, release planning, stakeholder alignment | Low | Comparing similar-priority items that all feel important |
Kano Model | Basic needs, Performance needs, Delighters | Customer satisfaction analysis, feature discovery, UX trade-offs | Medium | Internal tooling or B2B platform features where delight is less relevant than reliability, compliance, or workflow fit |
Weighted Scoring | Custom criteria with assigned weights | Cross-functional alignment, roadmap defense, executive prioritization | High | Small teams, fast-moving sprints, or decisions that do not need a formal scoring model |
When should I use the Eisenhower Matrix?
Use the Eisenhower Matrix when you need to separate urgent work from important work. The prioritization matrix is named after Dwight D. Eisenhower’s urgency/importance distinction and was later popularized as a four-quadrant time management model by Stephen Covey in The 7 Habits of Highly Effective People.
For product managers, it works best for triage: production incidents, urgent stakeholder requests, meeting overload, and operational work. It is weaker for feature prioritization because urgency and importance do not capture reach, effort, revenue impact, confidence, or user value.
When should I use a Value vs. Effort Matrix?
Use a Value vs. Effort Matrix when you need a fast way to identify quick wins and avoid expensive low-value work. It is best understood as a lean 2x2 prioritization approach also known as an impact-effort matrix, with variations used across Agile, design thinking, Six Sigma, and product-development workflows.
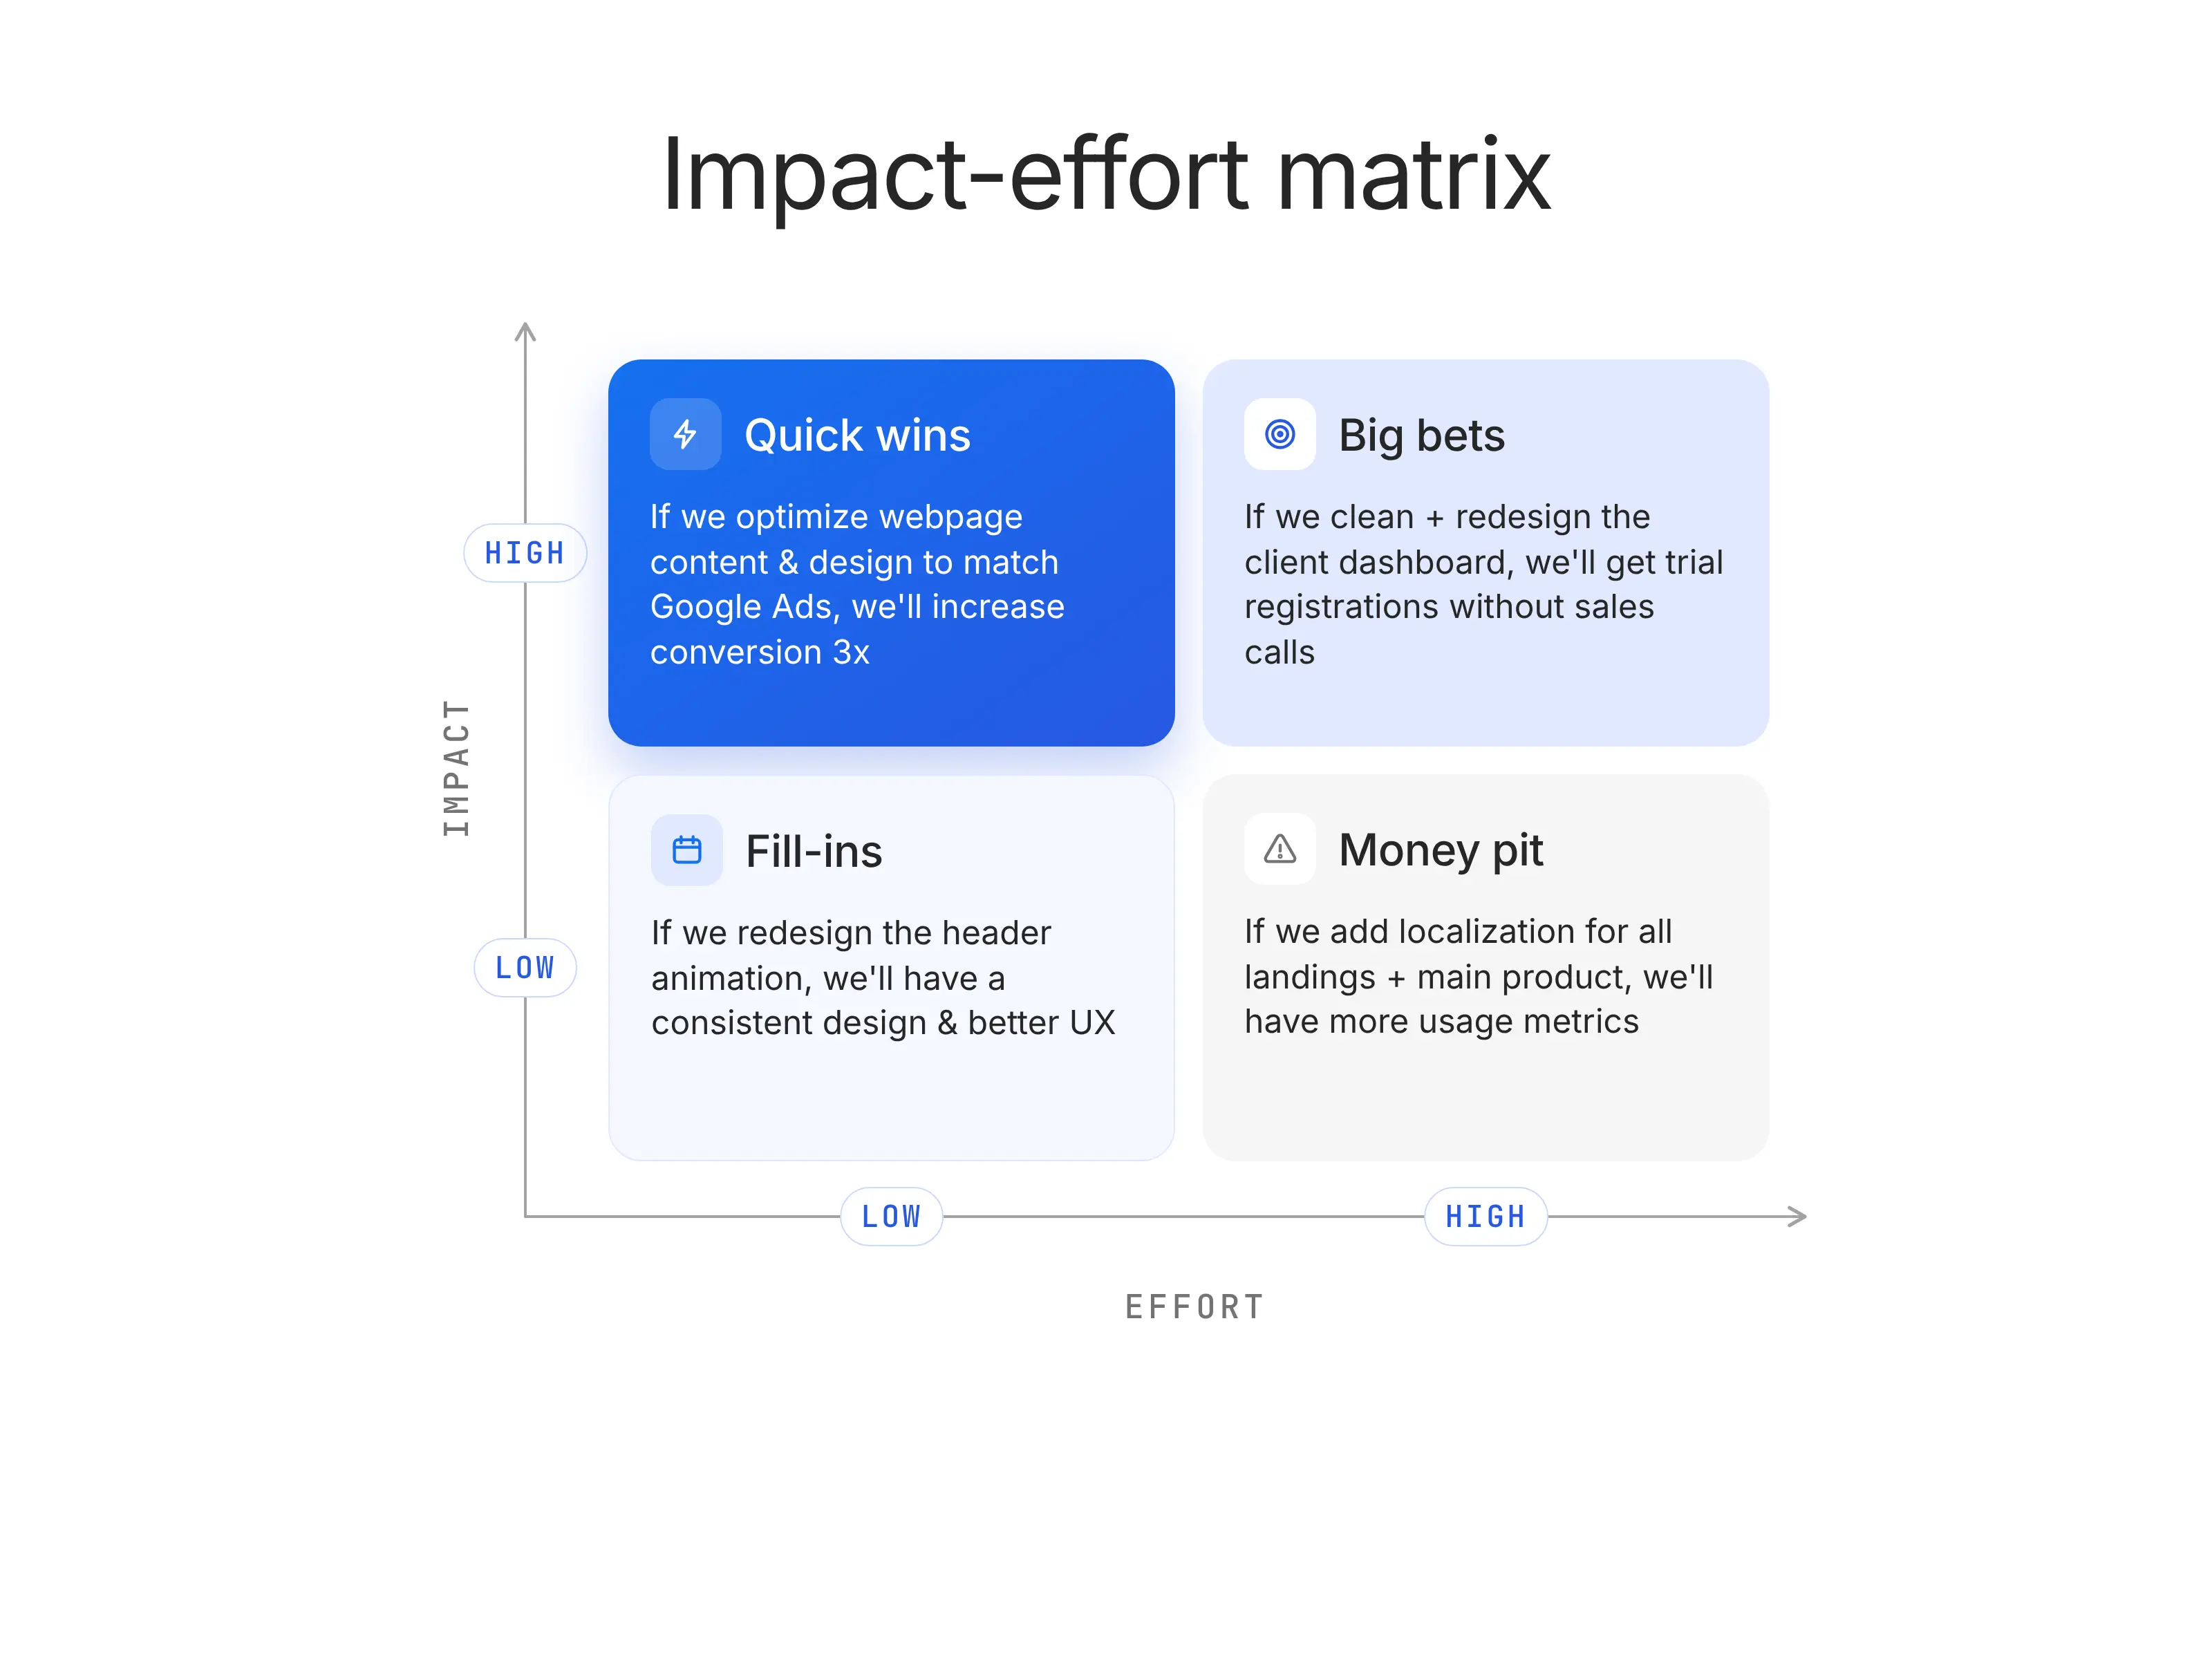
For PMs, it is especially useful in sprint planning and backlog grooming because it forces a simple trade-off: how much value does this create, and how hard is it to build? It is less useful for long-term strategic bets, where near-term effort may look high but the future upside is still worth pursuing.
When should I use RICE?
Use RICE when you have enough product data to compare initiatives by reach, impact, confidence, and effort. Intercom popularized the RICE model for product prioritization, defining the four scoring factors as Reach, Impact, Confidence, and Effort.
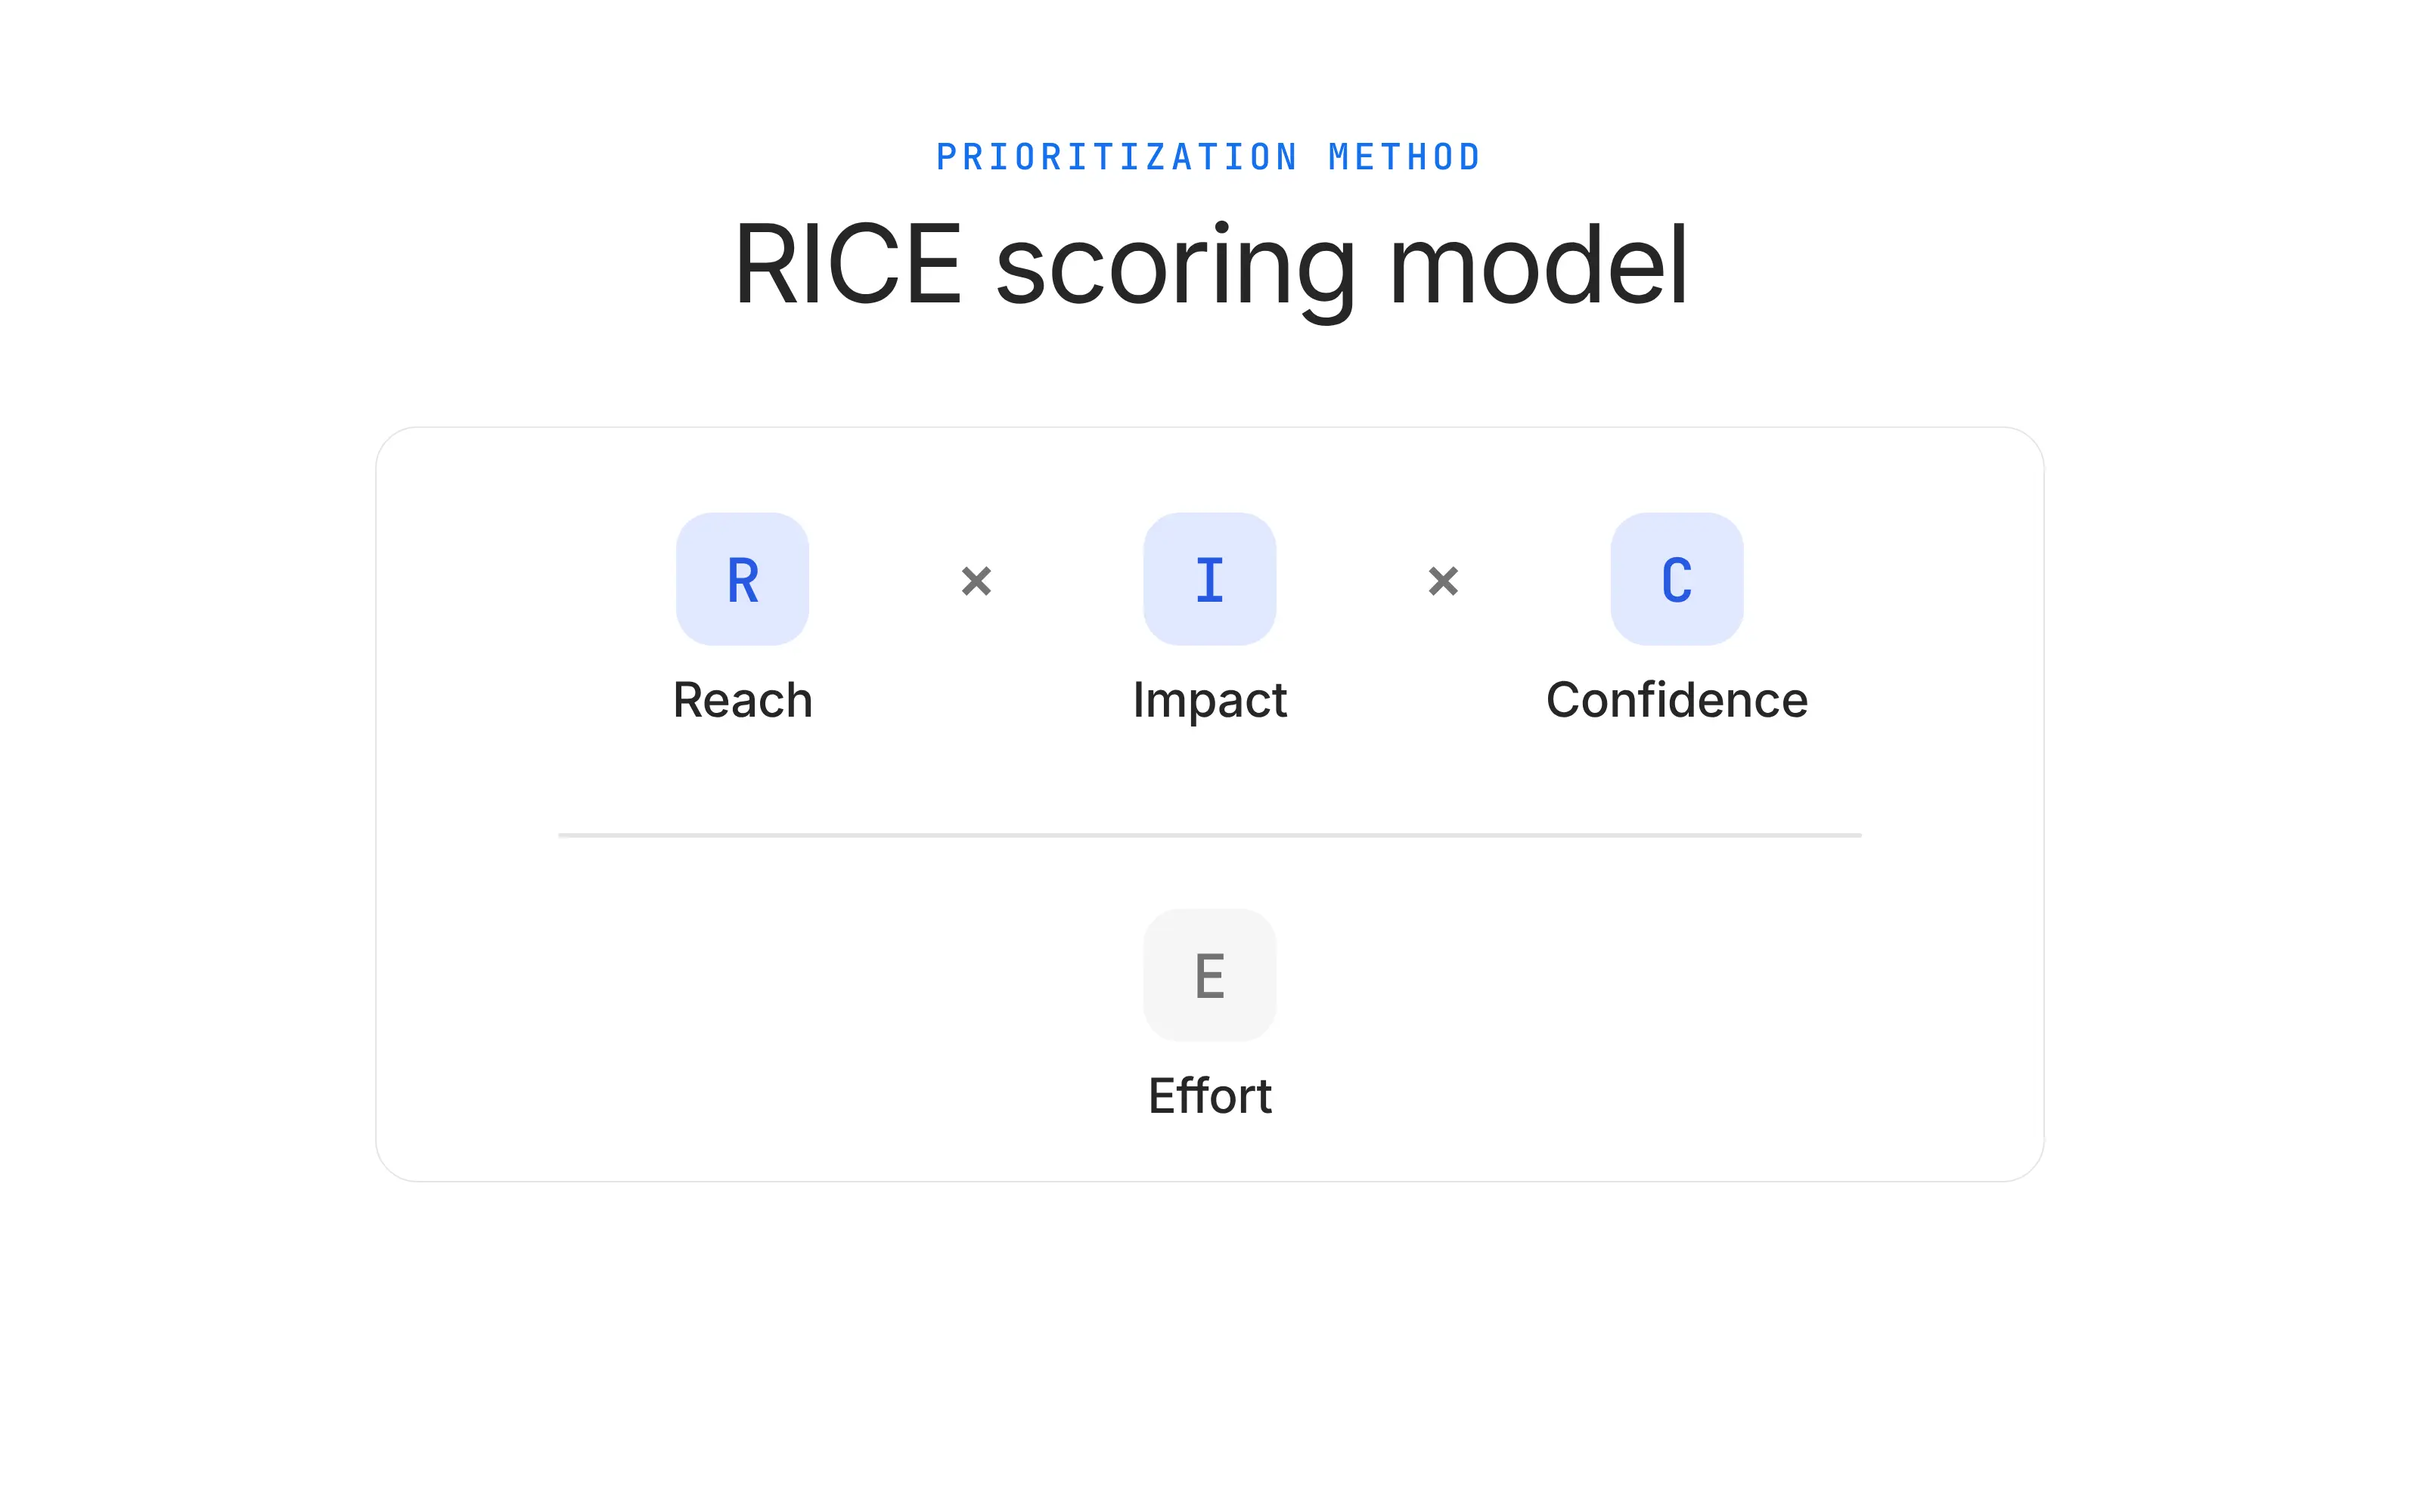
RICE works best when the team can estimate how many users an initiative will affect and how confident they are in the expected result. It is weaker for early-stage products, new markets, or discovery work where reach and impact are mostly educated guesses.
When should I use MoSCoW?
Use MoSCoW prioritization when you need to decide what belongs in a release, MVP, or fixed-scope launch. MoSCoW was developed by Dai Clegg at Oracle in 1994 and groups requirements into Must have, Should have, Could have, and Won’t have.
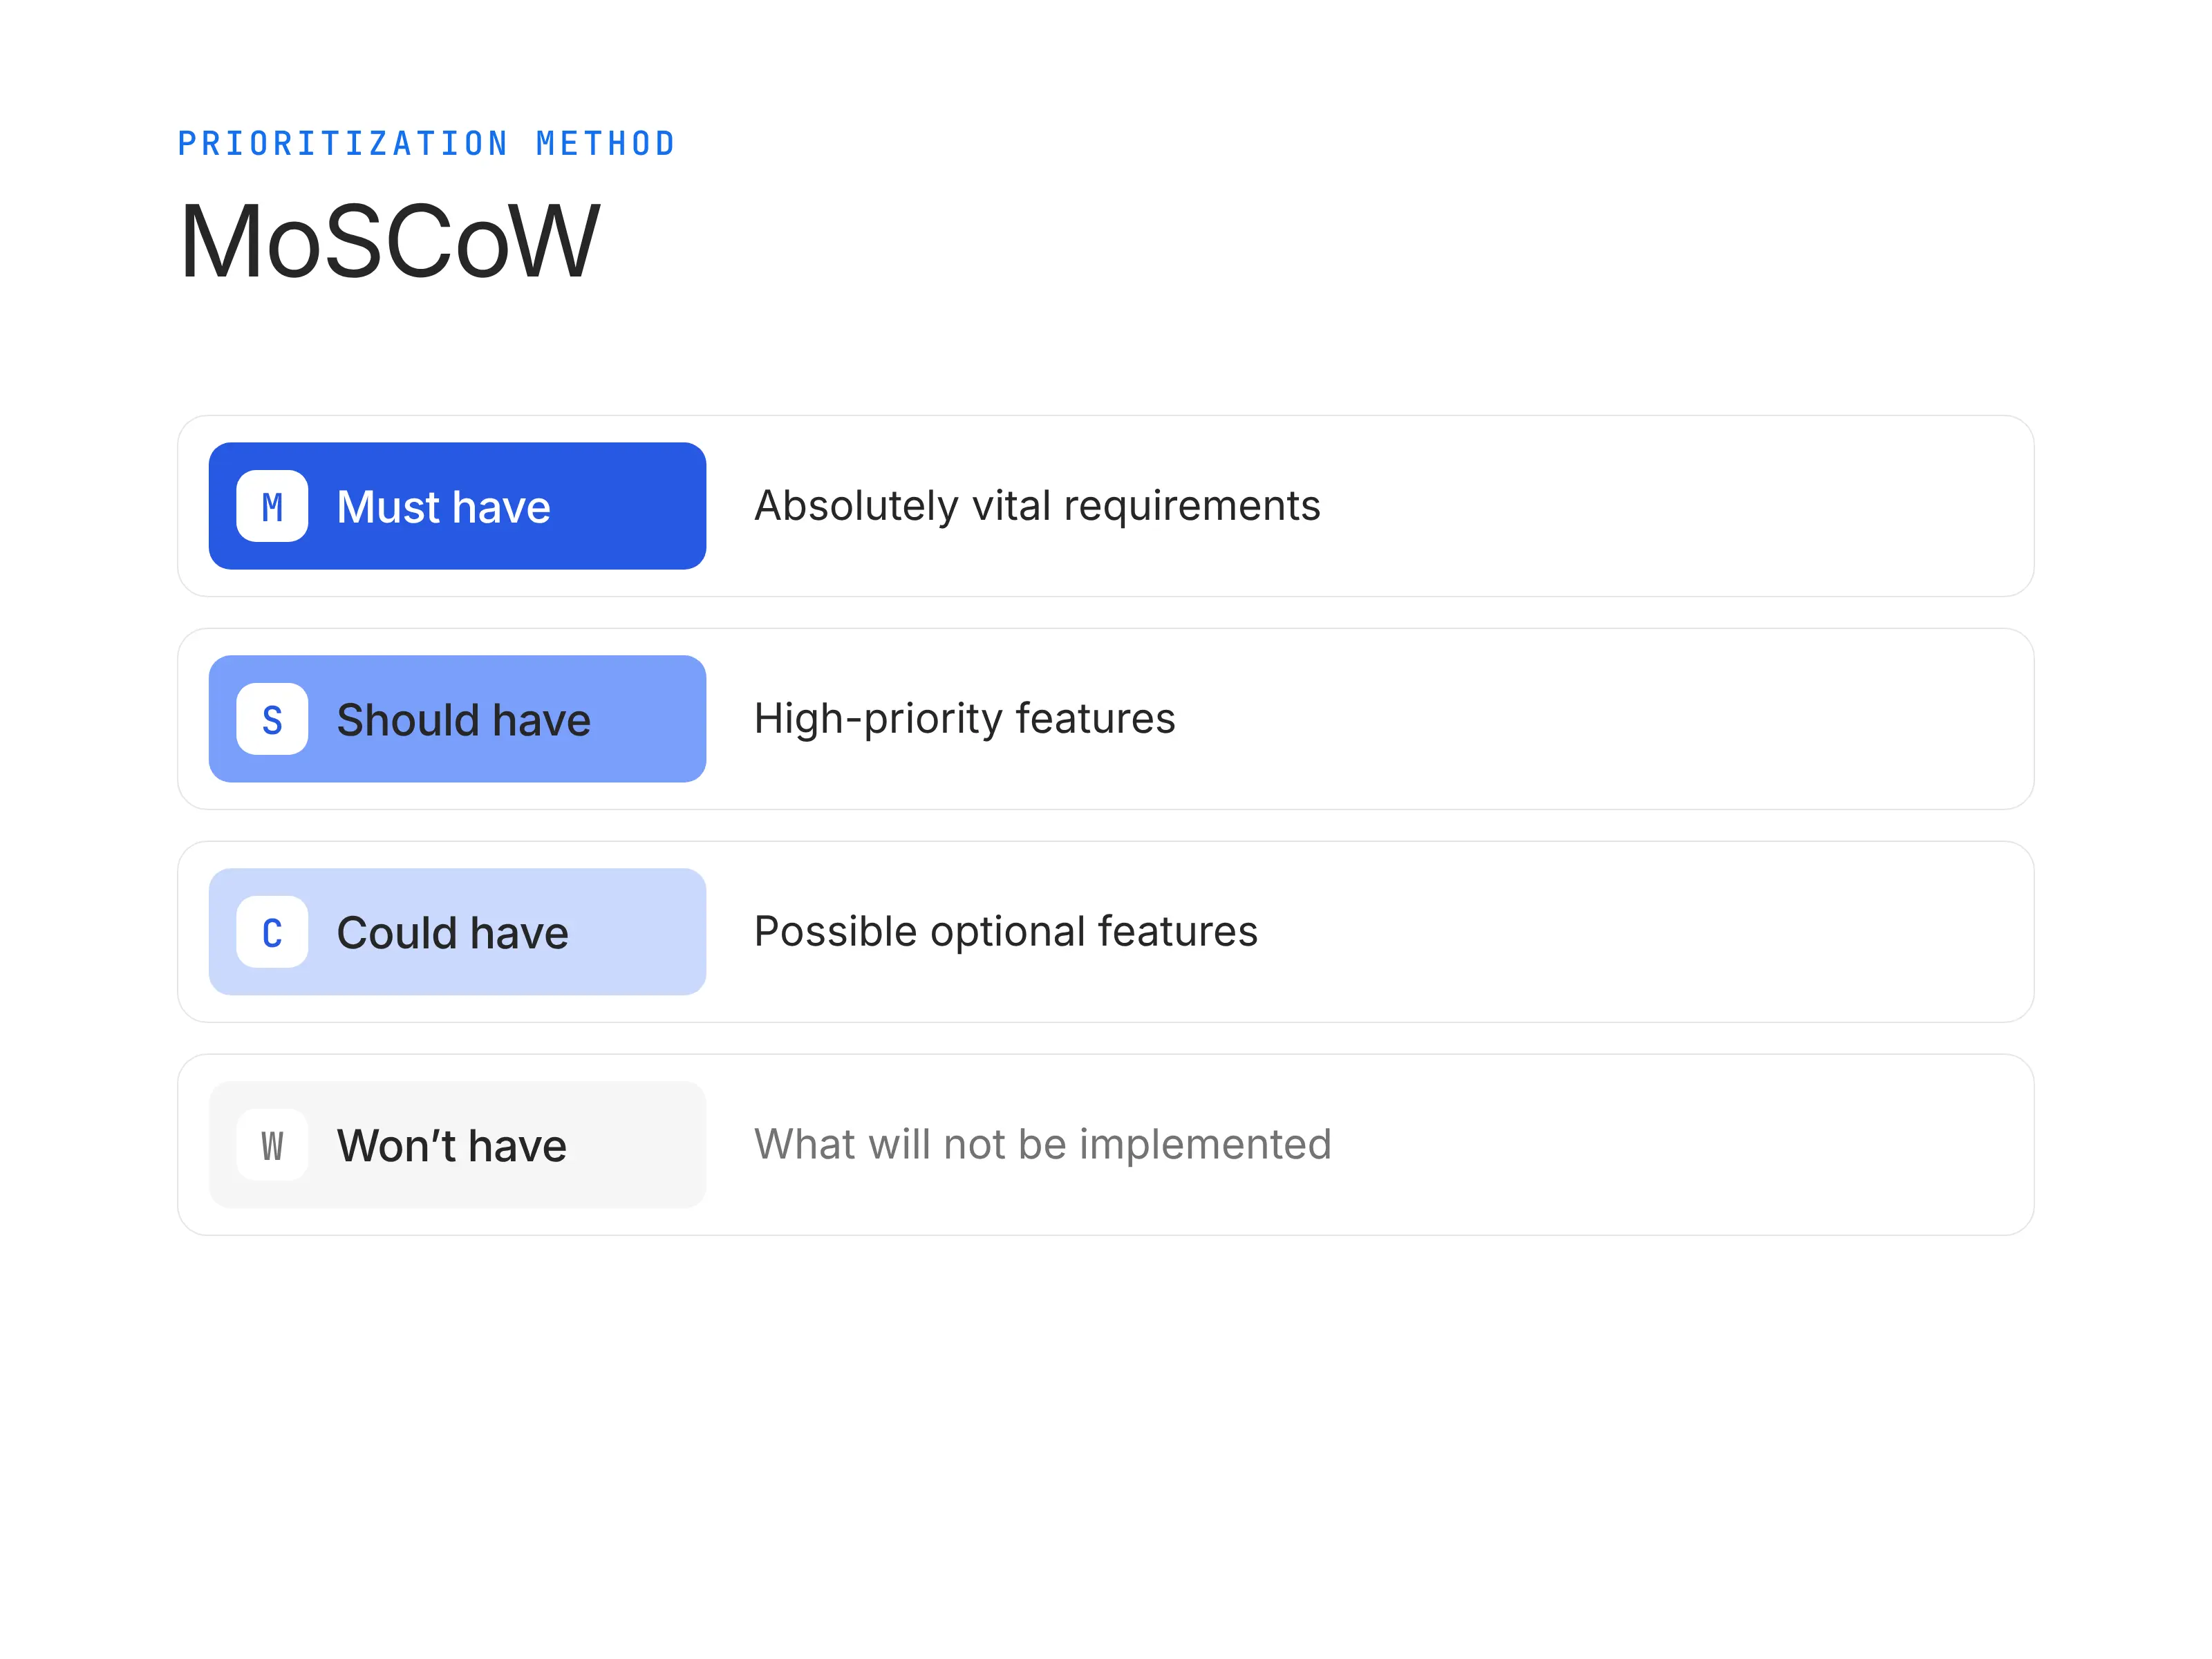
For product managers, MoSCoW is useful when stakeholders agree on the deadline but disagree on what must ship. It is less useful when every stakeholder labels their request as “Must have,” or when you need to rank several similarly important features with more precision.
When should I use the Kano Model?
Use the Kano Model when you need to understand how different features affect customer satisfaction. The model was published by Dr. Noriaki Kano, a professor of quality management at Tokyo University of Science, in 1984, and it classifies customer needs into categories such as basic expectations, performance attributes, and delighters.
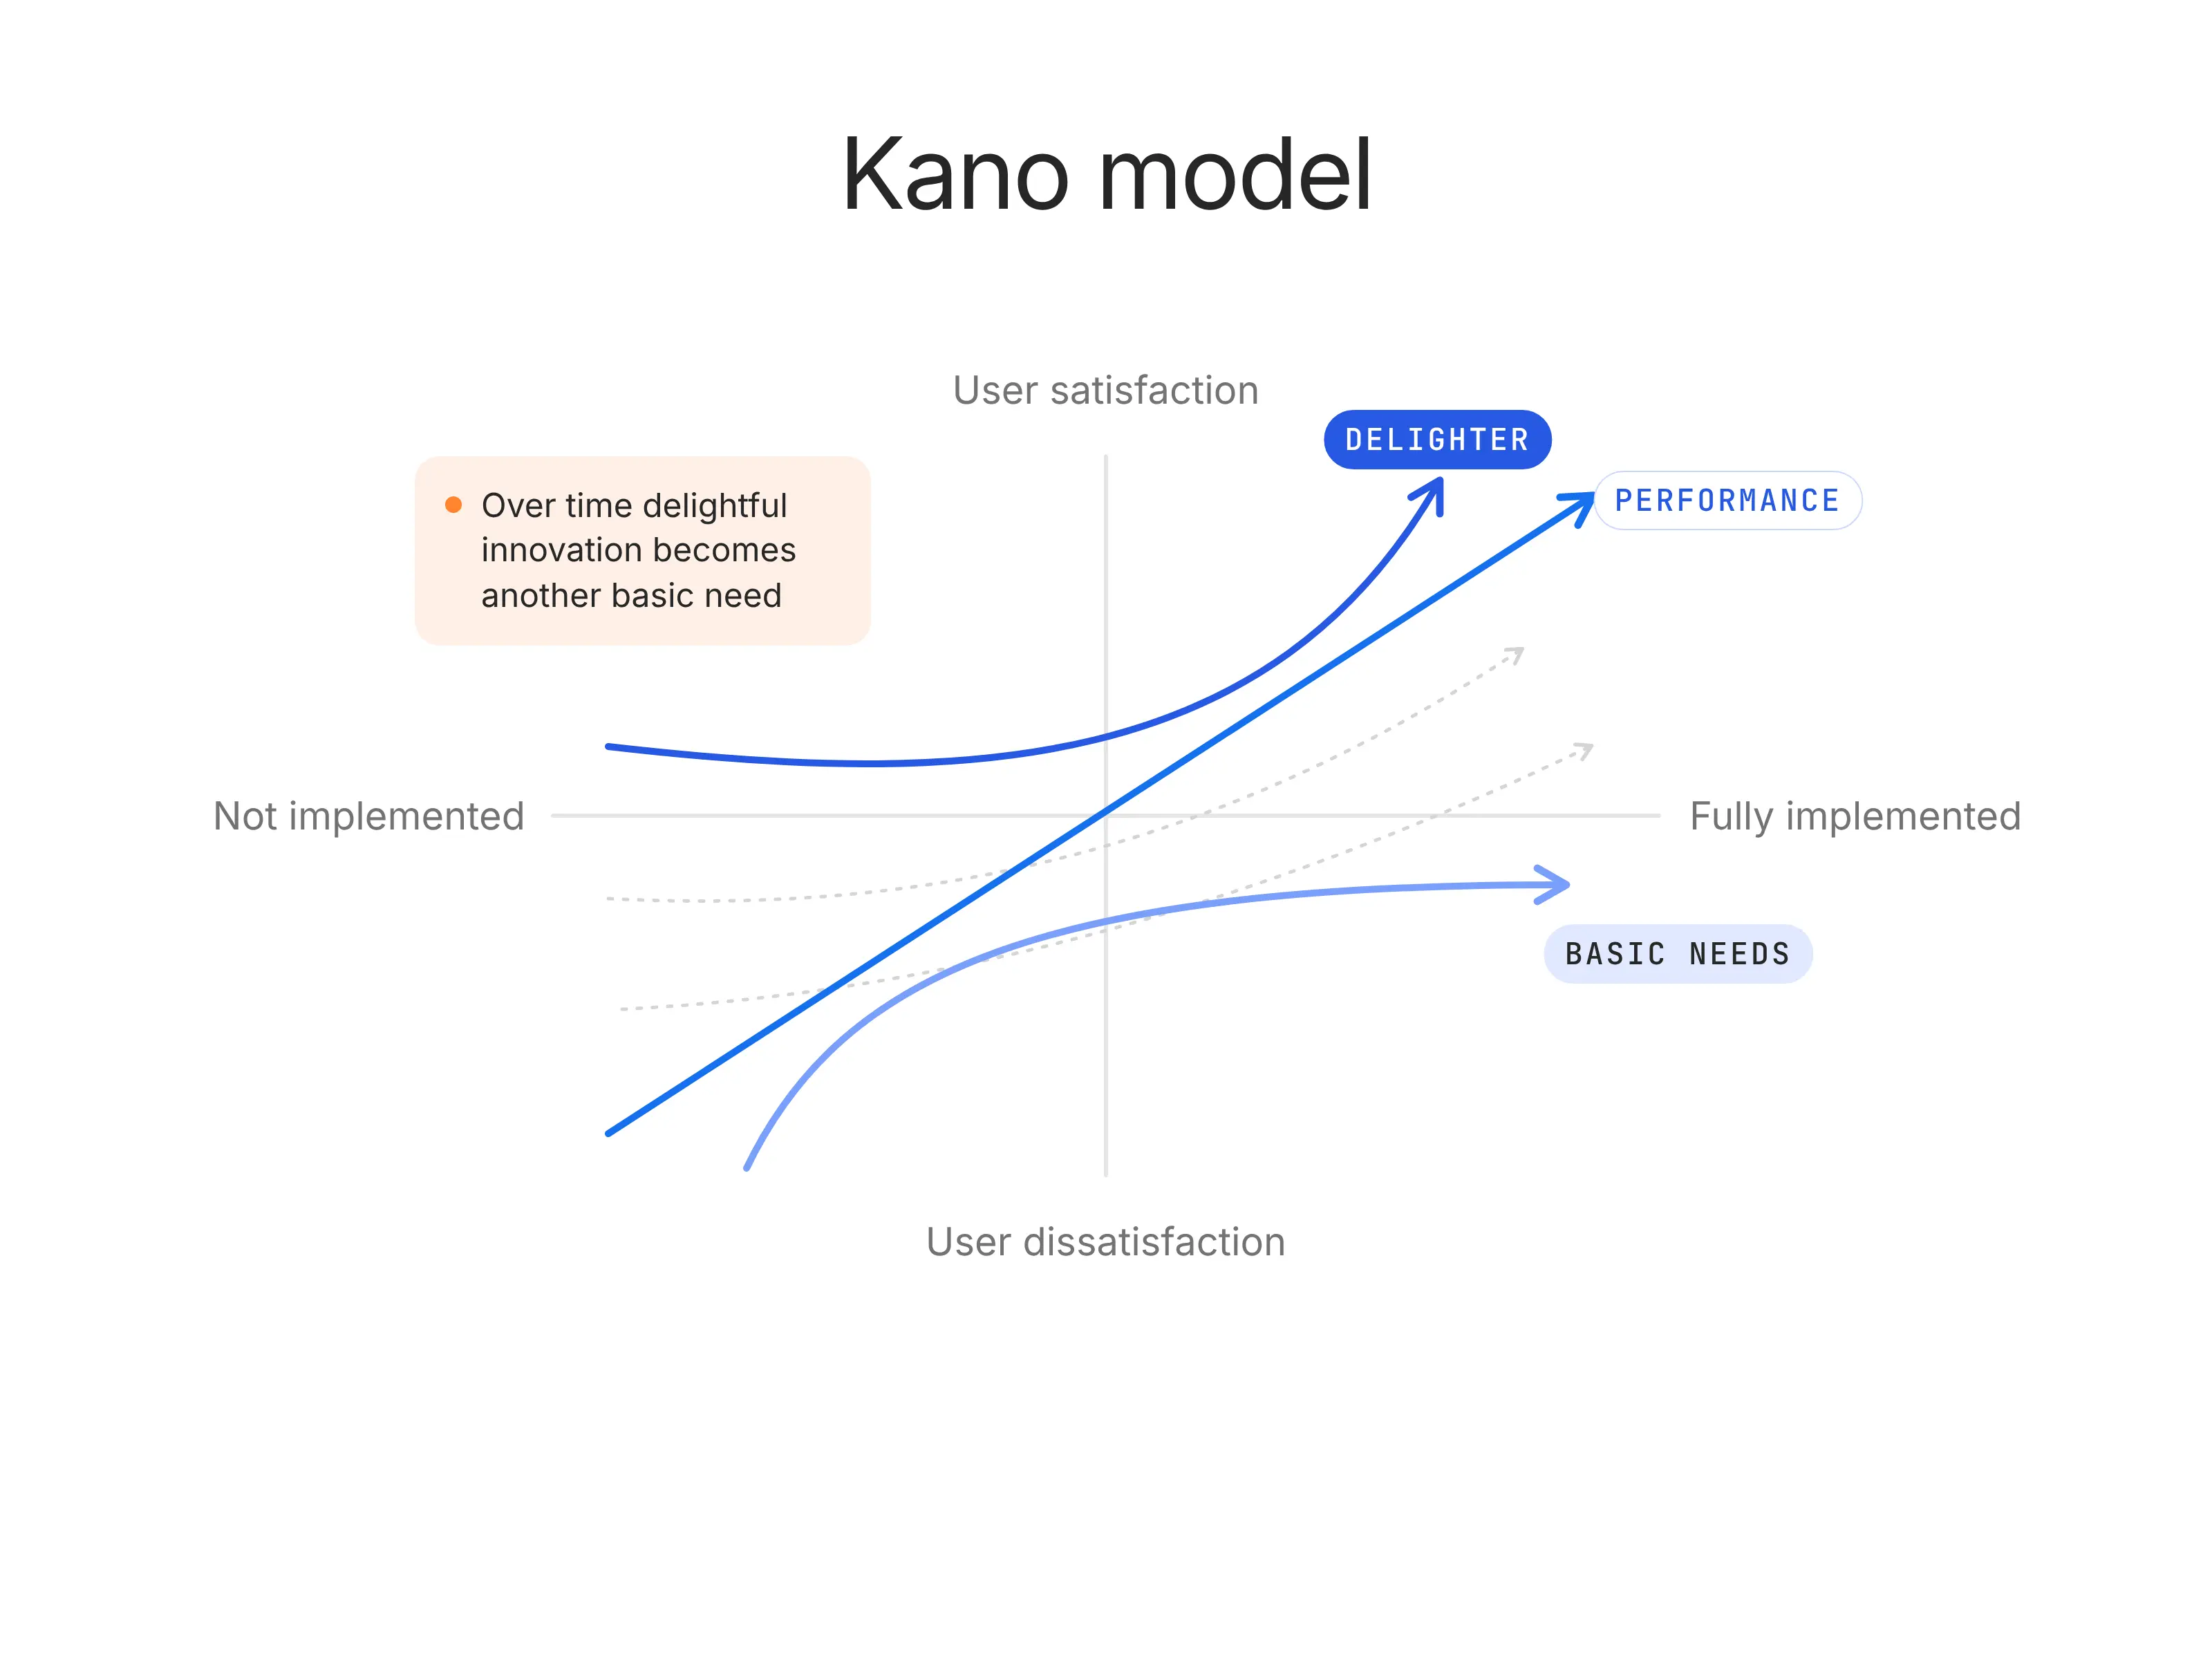
For PMs, Kano is valuable during continuous discovery because it shows which features customers simply expect, which ones increase satisfaction as they improve, and which ones can create delight. It is less useful for internal tooling, compliance work, or backend platform investments where customer delight is not the primary signal.
When should I use Weighted Scoring?
Use Weighted Scoring when you need a defensible prioritization model for complex, cross-functional product decisions. Weighted scoring does not come from one product-management inventor. It is rooted in multi-criteria decision analysis, where alternatives are scored across several criteria, and those criteria are weighted by importance.
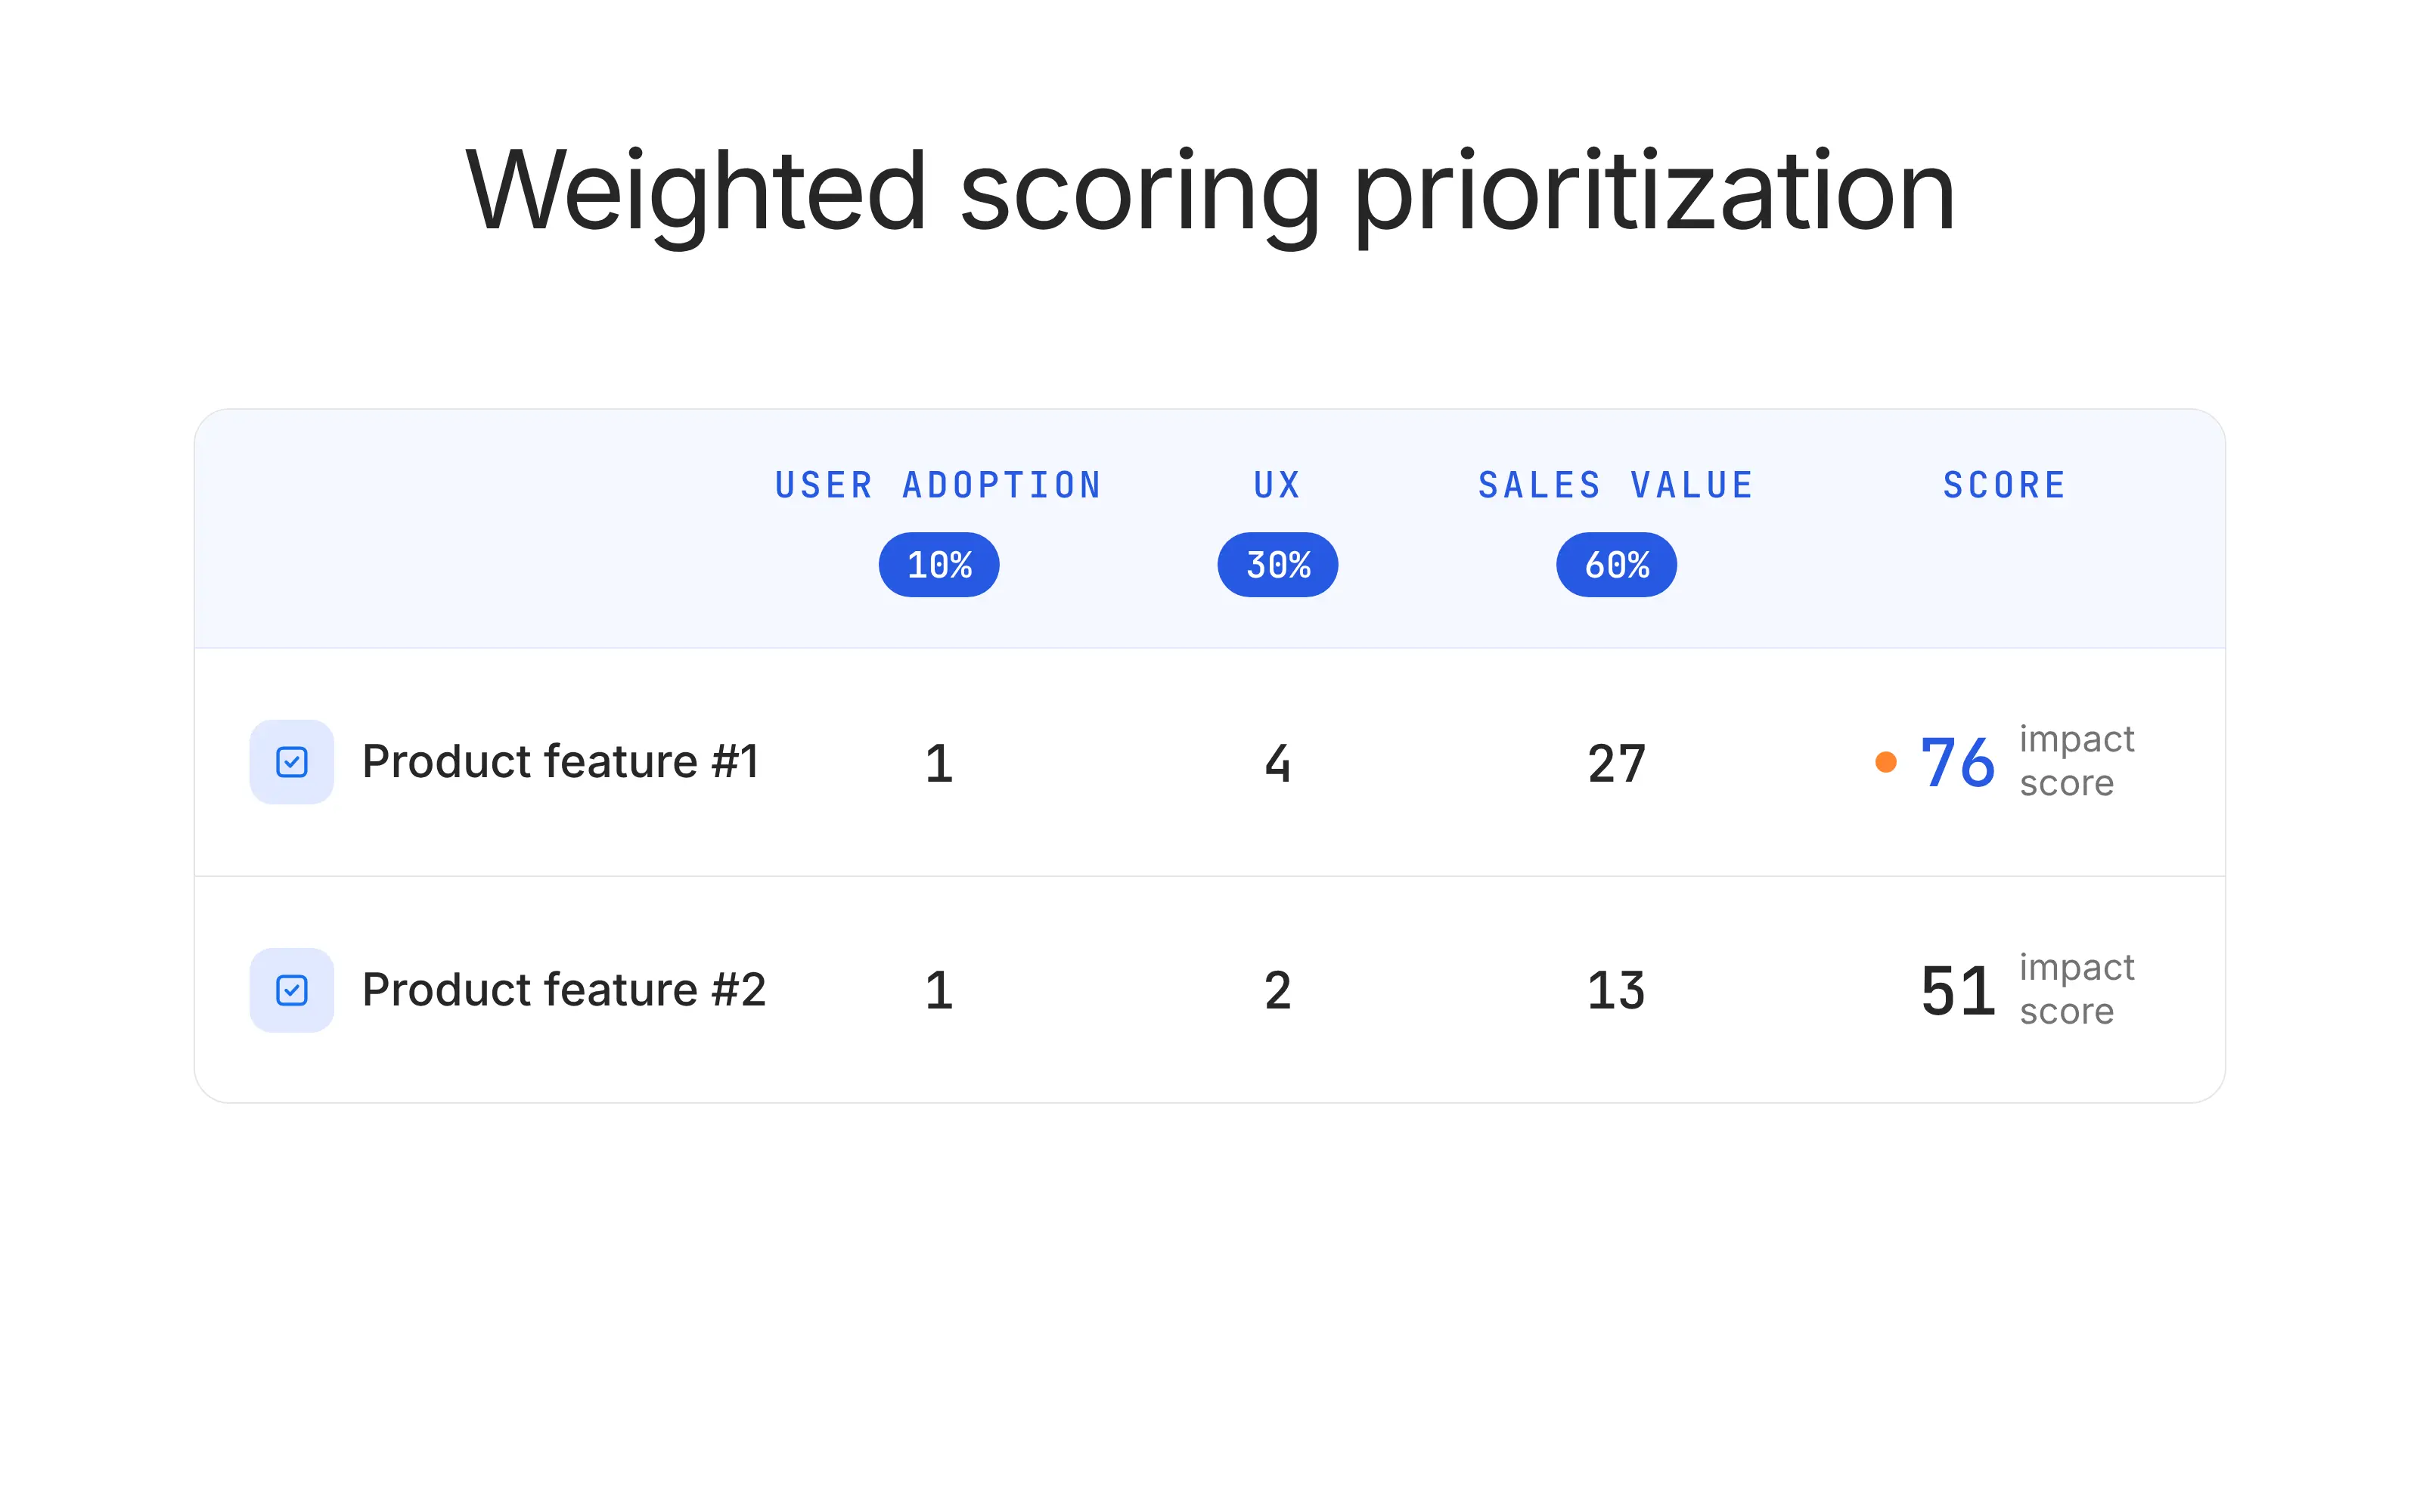
For product managers, Weighted Scoring is strongest in roadmap reviews, executive alignment, portfolio planning, and resource allocation because it makes the decision logic visible. It is usually too heavy for small teams, weekly sprint planning, or fast-moving work where a lighter Value vs. Effort matrix would be enough.
Prioritization Matrix Examples: 6 Ways to Score the Same Product Backlog
Imagine you manage TeamPilot, a B2B SaaS onboarding platform for customer success teams. Your team is choosing between five backlog items: a self-serve checklist builder, SAML SSO, CRM sync, AI onboarding summaries, and a custom PDF report designer.
Feature | Why It’s on the Backlog |
Self-serve checklist builder | Customers want to build onboarding checklists without asking support or implementation teams for help. |
SAML SSO | Enterprise prospects and larger customers need stronger authentication before expanding usage. |
CRM sync | Customer success teams want onboarding progress pushed into Salesforce or HubSpot. |
AI onboarding summaries | CSMs want an automatic summary of each account’s onboarding progress before customer calls. |
Custom PDF report designer | One large prospect asked for highly customized onboarding reports for leadership reviews. |
Value vs. Effort Matrix Example
The framework compares potential business or user value against the effort required to build the feature, which makes it useful for sprint planning, backlog grooming, and early roadmap decisions. It is often also called an Impact vs. Effort matrix or Action Priority matrix.
For this example, value and effort are scored from 1 to 10.
Value means the expected customer, business, or strategic benefit.
Effort means the expected engineering, design, data, and go-to-market work required.
The simple priority ratio is: Priority ratio = Value / Effort
Feature | Value Score | Effort Score | Calculation | Priority Ratio | Quadrant |
Self-serve checklist builder | 8 | 3 | 8 ÷ 3 | 2.67 | Quick win |
AI onboarding summaries | 7 | 4 | 7 ÷ 4 | 1.75 | Quick win |
SAML SSO | 9 | 7 | 9 ÷ 7 | 1.29 | Major project |
CRM sync | 8 | 8 | 8 ÷ 8 | 1.00 | Major project |
Custom PDF report designer | 4 | 7 | 4 ÷ 7 | 0.57 | Avoid or defer |
The checklist builder should move first because it creates high value with relatively low effort. It also supports the product goal directly: more customers can configure onboarding flows without waiting for implementation support.
AI onboarding summaries also land in the quick-win quadrant, but the lower ratio means the PM should validate whether the feature is truly needed now or can follow the checklist builder.
SAML SSO and CRM sync are high-value but high-effort projects, so they may belong on the roadmap, but not necessarily in the next sprint. The custom PDF report designer should be deferred because it creates narrow value for one prospect while consuming meaningful build time.
For the diagram, plot effort on the X-axis from low to high and value on the Y-axis from low to high. Add the five features as labeled dots. Use these quadrant labels: Quick Wins, Major Projects, Fill-Ins, and Avoid.
The visual should make the main decision obvious at a glance: Checklist Builder first, AI Summaries next, SAML and CRM as planned investments, PDF Reports out of scope.
RICE Prioritization Matrix Example
In this example, reach means the estimated number of users affected in one quarter. Impact uses a simple scale where 3 = massive impact, 2 = high impact, 1 = medium impact, 0.5 = low impact, and 0.25 = minimal impact. Confidence is expressed as a percentage. Effort is estimated in person-months.
Feature | Calculation | RICE Score |
Self-serve checklist builder | reach (1,800) × impact (2) × confidence (0.80) divided by effort (1.5) = 1,920 | 1,920 |
SAML SSO | reach (500) × impact (3) × confidence (0.90) divided by effort (3) = 450 | 450 |
CRM sync | reach (1,200) × impact (2) × confidence (0.70) divided by effort (4) = 420 | 420 |
AI onboarding summaries | reach (1,000) × impact (1) × confidence (0.60) divided by effort (2) = 300 | 300 |
Custom PDF report designer | reach (300) × impact (0.5) × confidence (0.50) divided by effort (3) = 25 | 25 |
RICE makes the checklist builder look even stronger than the Value vs. Effort matrix. The reason is reach. A self-serve checklist builder affects a large portion of the user base, has high expected impact, and does not require a huge build.
SAML SSO has a high impact score, but its reach is smaller because it mostly affects enterprise accounts. That does not mean it is unimportant. It means the PM should treat it as a strategic enterprise investment rather than a broad activation improvement.
CRM sync scores close to SAML SSO because it reaches more users but has lower confidence and higher effort. AI onboarding summaries score lower because the team has weaker evidence that the feature will change activation or retention.
The PDF report designer falls to the bottom because it has low reach, low confidence, and relatively high effort.
MoSCoW Prioritization Matrix Example
For this MoSCoW example, imagine TeamPilot has a six-week release window focused on enterprise onboarding activation.
Feature | MoSCoW Category | Why It Belongs There | Product Decision |
Self-serve checklist builder | Must Have | The release goal is to improve onboarding activation, and this feature directly removes a major setup bottleneck. | Build for this release. |
SAML SSO | Must Have | Enterprise expansion depends on meeting security expectations for larger accounts. | Build a scoped version. |
CRM sync | Should Have | It supports customer success workflows but does not block the core onboarding release. | Plan next if capacity allows. |
AI onboarding summaries | Could Have | Useful for CSM productivity, but the customer value is less validated. | Prototype or beta test. |
Custom PDF report designer | Won’t Have | Narrow value, high effort, and weak alignment with the release goal. | Remove from this release scope. |
MoSCoW is helpful because it turns prioritization into a scope conversation. Instead of ranking every item from 1 to 5, the PM asks which features are truly required for the release outcome.
The main risk is category inflation. If every stakeholder calls their request a Must Have, MoSCoW stops working. A practical fix is to define “Must Have” before scoring: if the release can still achieve its goal without the feature, it is not a Must Have.
In this example, the checklist builder and SAML SSO both qualify as Must Have, but for different reasons. The checklist builder supports the activation goal. SAML SSO supports enterprise readiness. CRM sync is important, but the release can still succeed without it. AI summaries and PDF reports should not distract the team from the core release.
Eisenhower Matrix Example
The framework is based on urgency and importance, producing four quadrants: urgent and important, important but not urgent, urgent but not important, and neither urgent nor important.
For product managers, the Eisenhower Matrix works best for triage. It is less precise than RICE or Weighted Scoring, but it is useful when urgent stakeholder pressure starts distorting the roadmap.
Feature | Urgency | Importance | Quadrant | PM Decision |
SAML SSO | High | High | Do Now | Prioritize because it affects enterprise deals and security readiness. |
Self-serve checklist builder | Medium | High | Schedule | Plan into the release because it directly supports activation. |
CRM sync | Medium | High | Schedule | Keep on the roadmap, but sequence after the highest-priority release work. |
Custom PDF report designer | High | Low | Delegate or Defer | Push back, re-scope, or handle manually for the individual prospect. |
AI onboarding summaries | Low | Medium | Schedule Later | Validate before committing engineering time. |
This matrix exposes a common product trap: urgency can sound like importance, especially when the request comes from sales, leadership, or a large customer.
The custom PDF report designer is the clearest example. It may feel urgent because a prospect asked for it, but the matrix shows that it does not support the broader product strategy. The PM can still help the sales team, but the answer may be a manual workaround, not a roadmap commitment.
SAML SSO, on the other hand, is both urgent and important. It affects enterprise readiness, security expectations, and near-term revenue. The checklist builder and CRM sync are important but less urgent, so they should be scheduled deliberately rather than rushed into the sprint without planning.
Kano Model Example
For Kano model example, assume TeamPilot interviewed 20 customer success leaders and admins. Each feature was tested with two questions: how they would feel if the feature existed, and how they would feel if it did not exist.
Feature | Kano Category | Customer Signal | Product Decision |
SAML SSO | Must-be | Enterprise admins expect it. Its presence does not delight them, but its absence blocks adoption. | Prioritize for enterprise readiness. |
Self-serve checklist builder | Performance | The better this works, the more customers feel in control of onboarding. | Prioritize because satisfaction rises with quality. |
CRM sync | Performance | Customers value it because it reduces duplicate work between TeamPilot and their CRM. | Build after core onboarding improvements. |
AI onboarding summaries | Attractive | Customers like the idea, but they do not yet expect it. Its absence does not create strong dissatisfaction. | Test with a beta group. |
Custom PDF report designer | Indifferent | Most customers do not care, except one prospect with a specific reporting workflow. | Do not prioritize unless the segment becomes strategic. |
Kano is valuable because it prevents teams from treating all customer requests equally.
SAML SSO is not exciting, but for enterprise customers it may be a basic expectation. That means it can be invisible when present and painful when absent. PMs should not deprioritize it just because users do not describe it as “delightful.”
AI onboarding summaries are different. They may delight users, but they are not yet expected. That makes them a good candidate for a beta, concierge test, or prototype before full roadmap commitment.
The checklist builder and CRM sync fall into the performance category because better execution should create more satisfaction. If the checklist builder is flexible and easy to use, it directly improves the onboarding experience. If it is clunky, it may create more work than it removes.
Weighted Scoring Matrix Example
For Weighted scoring example, TeamPilot scores each feature from 1 to 5 across five criteria. Higher scores are better. For effort, the score represents effort efficiency, so 5 means easier to build and 1 means very difficult.
Feature | Calculation | Weighted Score |
Self-serve checklist builder | customer impact (5 × 0.30) + strategic fit (4 × 0.25) + confidence (4 × 0.15) + effort efficiency (4 × 0.20) + risk reduction (3 × 0.10) = 4.20 | 4.20 |
SAML SSO | customer impact (4 × 0.30) + strategic fit (5 × 0.25) + confidence (5 × 0.15) + effort efficiency (2 × 0.20) + risk reduction (5 × 0.10) = 4.10 | 4.10 |
CRM sync | customer impact (4 × 0.30) + strategic fit (4 × 0.25) + confidence (3 × 0.15) + effort efficiency (2 × 0.20) + risk reduction (3 × 0.10) = 3.35 | 3.35 |
AI onboarding summaries | customer impact (3 × 0.30) + strategic fit (3 × 0.25) + confidence (2 × 0.15) + effort efficiency (3 × 0.20) + risk reduction (2 × 0.10) = 2.75 | 2.75 |
Custom PDF report designer | customer impact (2 × 0.30) + strategic fit (2 × 0.25) + confidence (2 × 0.15) + effort efficiency (2 × 0.20) + risk reduction (1 × 0.10) = 1.90 | 1.90 |
The formula is:
Weighted score = customer impact × 0.30 + strategic fit × 0.25 + confidence × 0.15 + effort efficiency × 0.20 + risk reduction × 0.10
Feature | Customer Impact | Strategic Fit | Confidence | Effort Efficiency | Risk Reduction | Weighted Score |
Self-serve checklist builder | 5 | 4 | 4 | 4 | 3 | 4.20 |
SAML SSO | 4 | 5 | 5 | 2 | 5 | 4.10 |
CRM sync | 4 | 4 | 3 | 2 | 3 | 3.35 |
AI onboarding summaries | 3 | 3 | 2 | 3 | 2 | 2.75 |
Custom PDF report designer | 2 | 2 | 2 | 2 | 1 | 1.90 |
Weighted Scoring produces the most executive-friendly version of the decision. It shows that the checklist builder and SAML SSO are both strong priorities, but for different reasons.
The checklist builder wins because it has the best overall balance of customer impact, strategic fit, confidence, and effort efficiency. SAML SSO finishes close behind because it has strong strategic value and risk reduction, even though it is harder to build.
This is exactly where Weighted Scoring helps PMs. A simpler matrix might make SAML SSO look too expensive. A stakeholder-driven conversation might make SAML SSO feel automatically urgent. Weighted Scoring shows the trade-off clearly: it is worth doing, but it needs deliberate planning because the effort is real.
How to Build Your Own Prioritization Matrix in 6 Steps
1. Define the decision before you define the criteria
Start by naming the exact decision the matrix needs to answer. “What should we build next quarter?” needs different criteria than “What goes into this sprint?” or “What stays in the MVP?”
Then choose 2–4 criteria that match that decision.
For a sprint, use value and effort. For a roadmap review, add strategic fit, confidence, or revenue impact. Keep the criteria tight. The more criteria you add, the easier it becomes to make the matrix look objective while quietly making it harder to use.
Here’s one practical move: write one sentence next to each criterion. For example: “Customer value means the feature solves a repeated pain point for an important user segment.”
2. Score with the team, not in a product vacuum
Score each feature with the people who understand the work from different angles. Product can bring strategy and customer context. Engineering can estimate technical effort and risk. Design can flag usability complexity. Sales and customer success can add market and customer evidence.
Use a simple 1–5 or 1–10 scale. Do not average scores too quickly. If product gives a feature a value score of 9 and customer success gives it a 4, that disagreement is the point of the exercise. Stop and ask what each person knows that the others do not.
Practical move: Ask everyone to score silently first, then discuss the biggest gaps.
3. Plot the work so trade-offs become visible
Once the scores are agreed, place each feature on the matrix. For a Value vs. Effort matrix, put effort on the X-axis and value on the Y-axis. The result should show four groups: quick wins, major projects, fill-ins, and items to avoid or defer.
This is where the matrix becomes useful. A feature with high value and low effort should move forward quickly. A feature with high value and high effort may still deserve roadmap space, but it needs planning. A low-value, high-effort feature needs a very strong reason to survive.
Practical move: Label every dot with the feature name. Anonymous dots make the matrix harder to discuss.
4. Set a prioritization cadence before the matrix goes stale
A prioritization matrix is useful only while the assumptions behind it are still true. Customer needs change. Engineering finds hidden complexity. Leadership changes the quarter’s goals. A competitor ships something that shifts the market.
Match the review cadence to the decision type. Sprint-level matrices should be reviewed during backlog grooming. Roadmap-level matrices should be reviewed monthly or quarterly. Release-scope matrices should be revisited when the deadline, team capacity, or launch goal changes.
Practical move: Add a recurring 30-minute “priority review” before sprint planning or roadmap reviews.
5. Communicate the decision with the logic behind it
Do not share only the final ranking. Share the criteria, scores, and trade-offs that shaped the decision. This is what makes the matrix valuable in stakeholder conversations.
Instead of saying, “We’re not building the PDF report designer,” say, “It scored low on reach and customer impact, while requiring high engineering effort. We’re prioritizing the checklist builder because it affects more accounts and directly supports onboarding activation.”
Practical move: Use a simple decision note: “Prioritized, delayed, or removed — and why.”
6. Revisit the matrix when evidence changes
The matrix should change when the evidence changes. Re-score an item when effort doubles, confidence drops, a customer segment becomes more strategic, new usage data appears, or a feature starts blocking revenue, retention, or adoption.
This prevents the team from treating old scores as permanent truth. A feature that looked like a low priority in January may become critical in March if three enterprise deals now depend on it. The matrix should support judgment, not freeze it.
Practical move: Mark every score with a confidence level: high, medium, or low. Low-confidence scores should trigger discovery before commitment.
Common Prioritization Matrix Mistakes
1. Scoring alone instead of with the team
Mistake: A PM scores the backlog alone, then presents the prioritization matrix as if it represents the whole team’s view.
Fix: Score with engineering, design, data, customer success, and relevant stakeholders in the room so value, effort, risk, and customer evidence are judged from multiple angles.
2. Treating effort estimates as facts
Mistake: Teams often use one effort score even though engineering estimates usually come with uncertainty, hidden dependencies, and technical risk.
Fix: Track effort as a range, such as 3–5 days or 2–4 sprints, and re-check any item where the high end of the range would move it into a different quadrant.
3. Choosing the wrong framework for the decision
Mistake: A team uses the same matrix for every decision, even though sprint planning, MVP scoping, roadmap planning, and executive trade-offs need different levels of detail.
Fix: Match the framework to the decision: use Value vs. Effort for quick wins, MoSCoW for release scope, RICE for measurable backlog items, and Weighted Scoring for complex roadmap decisions.
4. Confusing urgency with importance
Mistake: A request feels important because a stakeholder, customer, or executive needs it urgently, but urgency alone does not prove product value.
Fix: Score urgency separately from customer impact, strategic fit, and reach so the team can see whether the work is truly important or simply loud and time-sensitive.
5. Letting the loudest stakeholder set the criteria
Mistake: The matrix becomes political when criteria are shaped around one department’s goals, such as sales pushing revenue impact above every other factor or engineering over-weighting technical simplicity.
Fix: Agree on criteria before scoring starts and tie each one to the product goal, not to one stakeholder’s preferred outcome.
6. Never revisiting the matrix
Mistake: Teams treat the prioritization matrix as a one-time workshop output, even after customer feedback, usage data, engineering estimates, or company goals change.
Fix: Revisit the matrix on a fixed cadence and re-score any item when reach, effort, confidence, or strategic importance changes materially.
7. Making the scoring system too complicated
Mistake: A matrix with too many criteria, weights, decimals, and scoring rules can look rigorous while making the decision harder to understand.
Fix: Use the simplest model that can support the decision: two criteria for quick planning, three to five criteria for roadmap trade-offs, and weighted scoring only when the decision truly needs that level of detail.
Using AI to Maintain Your Prioritization Matrix in 2026
Today, AI should not replace prioritization judgment. It should keep the prioritization matrix cleaner and better connected to real product signals. The PM still owns the trade-offs and AI helps surface what changed.
AI Product Management Certification
Adopt an AI-first mindset: design AI-native UX, build agents, define modern PRDs, and ship trustworthy AI-powered products.
Enroll now
The most immediate use case is backlog hygiene. Tools like Aha! use AI to identify and merge duplicate feedback, uncover trends, and help teams prioritize what matters most. Productboard AI can summarize feedback notes, surface AI-generated topics and themes, and automatically link feedback from insights boards to feature ideas so each request is easier to include in prioritization decisions.
The second use case is scoring new requests against an existing rubric. A PM can paste a feature request into Claude, ChatGPT, or an internal AI workspace and ask it to score the request against the team’s criteria: reach, customer impact, strategic fit, confidence, risk, and effort assumptions. The output should be treated as a first pass, not a decision. Our own AI roadmap guidance frames this shift clearly: AI helps teams spot emerging user needs, forecast impact, and prioritize based on real signals instead of stakeholder noise.
The third use case is stakeholder synthesis. Instead of manually reading 40 sales notes, 25 support tickets, and three interview transcripts, AI can summarize feedback into themes, frequency, customer segment, sample quotes, and likely business impact. Practically, you could cluster onboarding complaints, compare free users against enterprise users, and turn that “noisy wall of text” into insight that can guide prioritization.
The fourth use case is priority drift detection. Set up a recurring AI workflow that checks whether an item’s reach, confidence, urgency, or customer evidence has changed. Jira Product Discovery’s Rovo AI already supports content generation and summarization inside ideas, comments, and insights. You can also use AI agents that ingest feedback daily, auto-cluster topics, and flag anomalies such as a spike in complaints about one feature or region.
As Gurav Kataria, VP of Product at Trello, said on the YouTube session: “We're using generative AI to estimate the relative prioritization because it’s as good and faster than us. It uses our own predefined criteria to estimate how long it will take to do a certain task. Then it automatically blocks time on people's calendars to do it.”
Free Prioritization Matrix Template
A prioritization matrix is most useful when the whole team can score features the same way. That’s why Product School’s Feature Prioritization Template gives PMs a structured way to compare product ideas, evaluate trade-offs, and decide what should move forward.
Feature Prioritization Template
Use this feature prioritization template to get clear direction on which features to include and which to leave out.
Download FreeUse this template when you need a more complete feature prioritization process for roadmap planning, release decisions, or stakeholder alignment. It is available in PowerPoint and Google Slides, so you can use it in workshops, planning sessions, or async roadmap reviews.
The full Feature Prioritization Template includes columns for feature idea, user problem, customer value, business impact, effort, confidence, strategic fit, final score, and prioritization decision. Teams can score each feature on a simple 1–5 or 1–10 scale, depending on how much detail they need. Unlike the simpler 2x2 Value vs. Effort matrix, this template gives PMs more context behind each decision, not just a quadrant placement.
Turn Your Prioritization Matrix Into a Product Habit
Good prioritization looks like a team that can explain why one feature moves forward and what evidence would change the decision.
That is the real value of a prioritization matrix. It gives product managers a shared way to make trade-offs before the roadmap becomes political.
So, start with one real backlog. Pick five features, score them with the Value vs. Effort example above, and plot them on the matrix. Then use the free template to repeat the process with your team before your next sprint planning session, roadmap review, or release decision.
Updated: October 23, 2026