"Just build a great product."
"Being early beats being better."
"Start small, scale fast."
"Build a strong community first."
"You can't fund your dream on a dime."
Catchphrases are as plentiful as products. Chances are, you've seen a few similar to these on Twitter or Linkedin. These wisdom bombs promise surefire product adoption. But in truth, they're just catchy words.
Even a massive community couldn't save McDonald's Arch Deluxe Burger from flopping spectacularly. Apple, usually on point, jumped the gun with an Apple Newton that was basically a glorified notepad. And Microsoft? They threw all the dimes you can imagine at Zune and users still wouldn’t adopt!
One-size-fits-all formulas are a rare delight in the product adoption process. Winning is more nuanced.
A mix of adoption and launch strategy, product experience, product value, and your product team setup determines the eventual success.
If that sounds like a lot to manage, there’s good news. We are about to spill the beans in this in-depth guide to product adoption.
Enroll in Product School's Product Strategy Micro-Certification (PSC)™️
The difference between a good and a great product lies in your Product Strategy, answering vital questions like: Who's the product for? What benefits does it offer? How does it further company objectives?
Enroll for Free
What is Product Adoption?
Product adoption is the process where potential customers start to use a new product regularly after trying it out. Essentially, it's about getting people to adopt your product into their daily routine.
The journey begins when potential customers first hear about your product. Then they try your product. If all goes well, these new users find value in what you’re offering. Meaning they gradually start to use your product.
This transition from curiosity to necessity is what product adoption is all about. If you play the cards right, you can improve the chances of success of any new product.
What is the Product Adoption Process?
The product adoption process is the journey potential customers go through from first learning about a product to becoming regular users. Understanding all the steps within the process helps improve product adoption and increase the product adoption rate. Here are the six stages:
Awareness: This is when potential customers first become aware your product. Effective promotion is key to making people perceive the value of your product.
Interest: At this stage, customers seek more information. They want to understand how your product can benefit them. Providing clear, compelling details helps increase product adoption.
Evaluation: Here, customers compare your product with others. They want to see if it's a good product worth adopting. Highlighting unique features and benefits relevant to your audience makes a strong product adoption.
Trial: New users try the product to see if it meets their needs. Offering free trials or demonstrations can boost the product adoption rate by giving users firsthand experience.
Adoption: If the trial is successful, customers start to regularly use the product. Ensuring a positive user experience is crucial to get them to adopt a product fully.
Advocacy: Satisfied customers become advocates. They recommend the product to others. This word-of-mouth promotion can improve product adoption.
Each stage is different. By tailoring your strategy for each one, you can better understand how to guide potential customers through the new product adoption process. This will ultimately increase the product adoption rate and ensure the long-term success of your product.
11 Metrics to Measure Product Adoption
Understanding and tracking product adoption metrics is essential for any product team looking to make corrections along the way. Frankly, you won’t get everything right from the start. You need a data-backed method to take appropriate actions.
Just like product launch metrics, these metrics provide valuable insights. You get to understand how users engage with your product, highlight areas of strength, and pinpoint opportunities for improvement. This understanding is crucial to increase adoption and ensure your product offers real, palpable value to users.
1. Adoption rate

The adoption rate measures the percentage of new users who start using your product for the first time over a specific period. This metric tracks how many users adopt a new product, providing insights into product adoption and engagement.
A high adoption rate means people become aware of your product and embrace it, while a low adoption rate suggests barriers to entry or unmet user needs.
Components:
Number of new users: Users who started using the product in the given time period.
Total number of users: All potential users in the same period.
2. Time to adoption
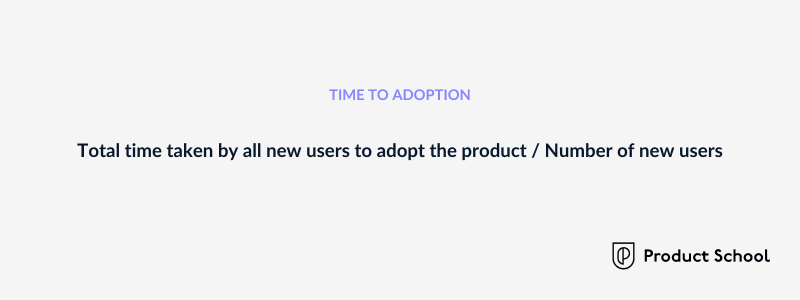
Time-to-adoption measures the average time it takes for new users to start using your product after they first hear about it. This metric reflects the efficiency of your product launch, onboarding process and initial product experience, which are key components of the product adoption lifecycle.
Faster adoption times suggest your product offers immediate value and ease of use, leading to higher overall adoption rates.
Components:
Total time taken by all new users: Sum of the time taken by each new user from awareness to adoption.
Number of new users: Users who started using the product in the given time period.
3. Activation rate
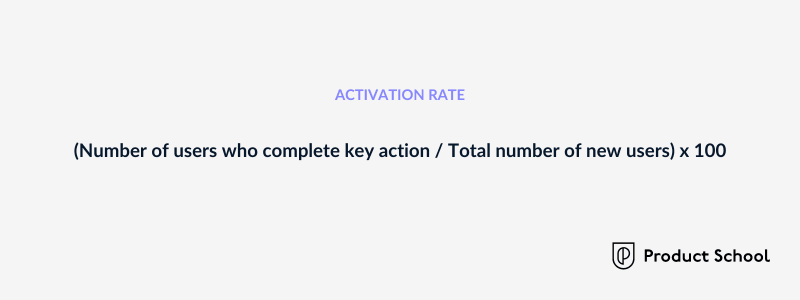
The activation rate tracks the percentage of new users who take a specific key action within your product, indicating they have experienced its core value. This metric shows how effectively your product delivers on its promises and engages users from the start.
High activation rates typically lead to better retention and overall product success.
Components:
Number of users who complete key action: Users who have taken the action that signifies they've experienced the product’s core value.
Total number of new users: Users who started using the product in the given time period.
4. Retention rate
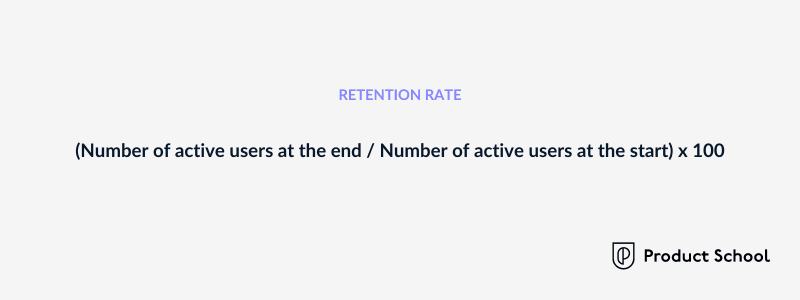
Retention rate measures the percentage of users who continue to use your product over a certain period. This metric is crucial because retaining users is often more cost-effective than acquiring new ones. It indicates ongoing satisfaction and loyalty. High retention rates suggest that your product consistently meets user needs and expectations.
Components:
Number of active users at the end of the period: Users who are still using the product at the end of the time period.
Number of active users at the start of the period: Users who were using the product at the beginning of the time period.
5. Churn rate
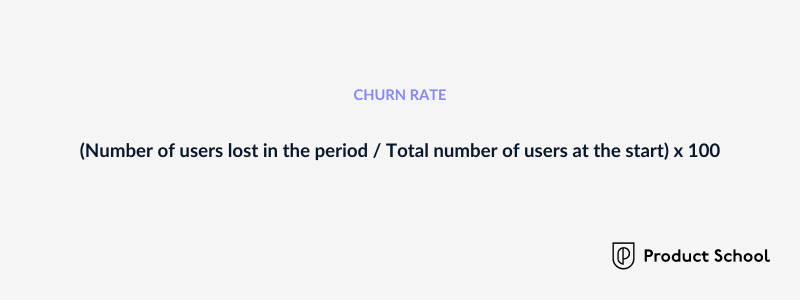
The churn rate tracks the percentage of users who stop using your product over a certain period. This metric is important because it highlights potential issues with your product or user experience. A high churn rate indicates dissatisfaction or unmet needs, while a low churn rate suggests that users find ongoing value in your product.
Components:
Number of users lost during the period: Users who stopped using the product in the given time period.
Total number of users at the start of the period: Users who were using the product at the beginning of the time period.
6. Percentage of daily active users (DAU)
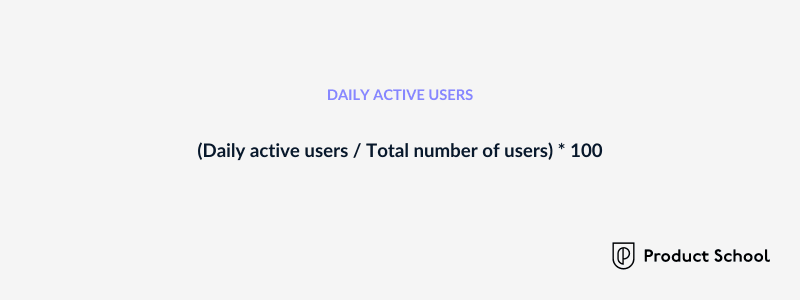
DAU measures the number of unique users who engage with your product on a daily basis. This metric is crucial for understanding user engagement and the overall health of your product. High DAU indicates that users find your product valuable and are incorporating it into their daily routines.
Components:
Total number of unique users per day: Users who interact with the product on a given day.
7. Percentage of monthly active users (MAU)
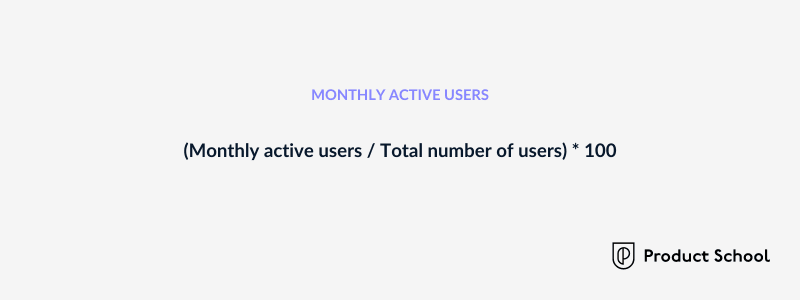
MAU measures the number of unique users who engage with your product on a monthly basis. This metric provides a broader view of user engagement and helps identify long-term trends. High MAU indicates sustained interest and value, while significant changes can highlight seasonal trends or issues that need addressing.
Components:
Total number of unique users per month: Users who interact with the product within a given month.
8. Customer lifetime value (CLV)
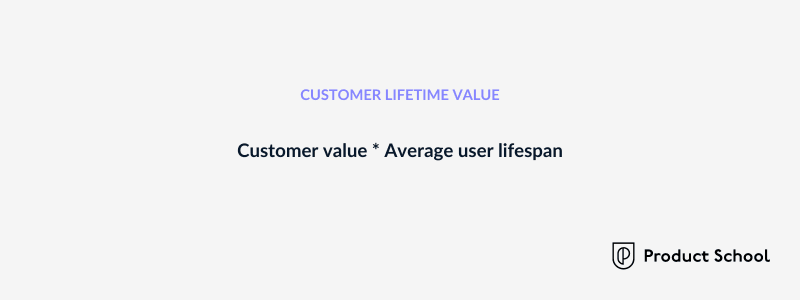
CLV estimates the total revenue a user will generate over their entire relationship with your product. This metric is important for understanding the long-term value of your users and guiding investment decisions in user acquisition and retention strategies.
Components:
Customer value: You can calculate this by multiplying average purchase value with average frequency rate.
Average user lifespan: The average length of time a user continues to make purchases.
9. Customer acquisition cost (CAC)
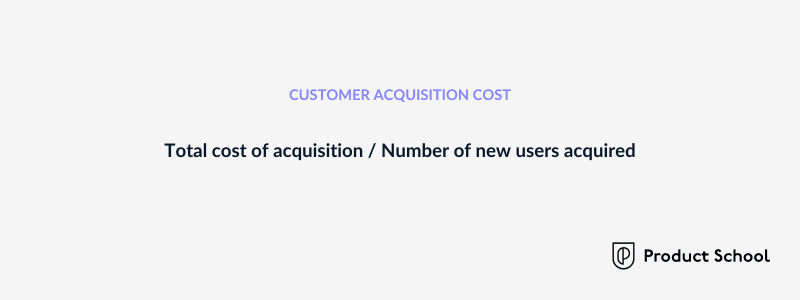
CAC measures the average cost of acquiring a new user. This metric is crucial for evaluating the efficiency of your marketing and sales efforts. A low CAC compared to CLV indicates a sustainable growth strategy, while a high CAC may suggest the need for more cost-effective acquisition methods.
Components:
Total cost of acquisition: The total amount spent on marketing and sales efforts to acquire new users.
Number of new users acquired: Users who started using the product as a result of the acquisition efforts.
10. Net promoter score (NPS)

NPS measures user loyalty by asking how likely they are to recommend your product to others, which can boost adoption through word-of-mouth. This metric is important because high scores indicate satisfied users who can drive growth through word-of-mouth, while low scores highlight areas for improvement.
Components:
% of Promoters: Users who rate their likelihood to recommend the product as 9 or 10.
% of Detractors: Users who rate their likelihood to recommend the product as 0 to 6.
11. Feature adoption rate
This metric tracks how many users adopt a new feature within your product. It shows which features are driving engagement and value, helping you understand what resonates with users and where to focus development efforts.
Components:
Number of users using the new feature: Users who have started using the new feature.
Total number of users: All users who have access to the feature.
By collecting and analyzing these metrics, you can better understand how users interact with your product, identify areas for improvement, and ultimately drive higher adoption rates and product success. These insights will help you increase adoption, ensure that users get value from your product, and build a sustainable growth strategy. In turn, this supports the entire adoption lifecycle.
Rethinking Product Adoption Failure
After a failed adoption, some often feel they have the right to claim the product was doomed from the start. That seems too simple. If the product was so bad, why wasn't it obvious from the start? Serious companies clearly have done market research, risk assessments, and come up with a product launch plan. How is it possible the clues just slipped through the cracks?
In 1979, Daniel Kahneman and his associate Amos Tversky coined the term "loss aversion". In their words, it takes place when the response to losses is stronger than the response to corresponding gains. Thus, most people feel the pain of losing $100 more intensely than the joy of finding it. This tendency to prefer avoiding losses over acquiring equivalent gains is called loss aversion.
Loss aversion makes people value products they already own more than those they don't. It's not just failed products — all new products are doomed from the start! It's a harsh, unforgiving game you're playing. In fact, according to Clayton Christensen from Harvard Business School, as reported by MIT, 95% of product launches fail.
Therefore, keep in mind these four principles of product adoption:
People judge an option's value based on how they perceive it, not its actual worth.
Consumers compare new products or investments to what they already own or use.
Improvements from this comparison are seen as gains, while any drawbacks are viewed as losses.
Those losses impact people much more than similar-sized gains
What is a Product Adoption Curve?
The technology adoption curve is a model that shows how different groups of people adopt a new product over time. It's based on a theory developed by social scientist Everett M. Rogers in his book "Diffusion of Innovations."

Understanding this curve and how the loss aversion affects each group helps you drive product adoption and influence product adoption rate. The curve is divided into five segments:
Innovators: They are the first to adopt a product. Think of them as superfans — they love new technology and are willing to take big risks. For instance, early adopters of highway-capable electric cars were either tech enthusiasts or Elon's fans.
Early Adopters: This group follows the innovators. They are opinion leaders and influence others. Think of the people who bought the first iPhones, gave it a test, and raved about great new features to friends and family. Perhaps they ignored the phone's bulky form, short battery life, and slow analog cellular networks.
Early Majority: This larger group adopts a product once it has been proven. They want to see that the product is reliable and has value. When streaming services like Netflix started gaining traction, the early majority followed thanks to the good word of early adopters.
Late Majority: These individuals are more skeptical and wait until most of their peers have adopted the product. They need reassurance from the early majority. Most people belong to the Late Majority. That’s why it took around 6 years for “people” to actually switch to smartphones.
Laggards: The last group to adopt a product. They resist change and only do so when absolutely necessary. We guess some people still hold onto their Motorola flip phones.
By understanding the product adoption curve, you can drive adoption to each group using different strategies.
This model helps highlight the value of your product at each stage. In general, innovators and early adopters like knowing they got first dibs. They also love exploring the new way in which your product solves the problem. Early and late majority, on the other hand, may appreciate palpable use cases, social proof, and seeing that their peers or competitors are already using it.
Tools to Measure Product Adoption Metrics
Understanding product adoption metrics is crucial for any business looking to grow and succeed. Many SaaS companies also use custom tools and metrics tailored to their specific needs, so the list below is not limited to these commercial solutions.
Google Analytics: A powerful tool for tracking website traffic, user behavior, and conversion rates.
Mixpanel: Focuses on user engagement and behavior analytics, ideal for tracking user actions, retention rates, and feature adoption rates.
Amplitude: Designed for product intelligence, offering comprehensive insights into user behavior, product usage, and cohort analysis.
HubSpot: Provides tools for tracking customer acquisition, engagement, and retention, integrating marketing, sales, and service data.
Intercom: Offers messaging tools and user tracking to engage with customers directly, improving activation rates and retention.
Pendo: Helps with product usage analytics and user feedback, ideal for tracking feature adoption rates and understanding user engagement.
Salesforce: Offers comprehensive CRM capabilities, tracking customer interactions, sales data, and user engagement.
UserTesting: Provides platforms for gathering user feedback and conducting usability tests, essential for understanding user experience.
Hotjar: Combines analytics and feedback tools to understand user behavior and gather direct feedback.
Looker: Offers business intelligence and data analytics, helping visualize and understand complex data from multiple sources.
Gainsight: Focuses on customer success and product analytics, tracking NPS, retention rates, and overall product health.
Improve Product Adoption Right Now
Set goals and define adoption metrics
The first step in measuring product adoption is setting clear goals. Then, define the metrics that will help you track progress to those goals.
Identify which metrics from the list above clearly indicate that your goals are being met. Is it retention rate, feature adoption, or customer lifetime value? Pinpoint the most important and focus on those.
The metrics you choose will guide your product adoption KPIs and align with your business objectives.
Use the right tools
To effectively measure and enhance product adoption, you need the appropriate product adoption software and analytics tools. These tools help you collect and analyze user data, providing insights into user behavior and engagement.
Start by integrating an analytics tool into your product. Evaluate whether the custom or commercial solution is a more cost-effective option.
Then, define key in-app events and set up dashboards to track user behavior. Collect session data to understand user journeys and identify friction points. Use features like session replays and heatmaps to delve into the root causes of user behavior.
Analyzing this data will help you spot trends and gain valuable insights, enabling you to optimize your product adoption strategies over time.
Identify user groups and track activity
To better understand your customers, split your customers into segments to highlight behavior patterns. This approach allows you to tailor your marketing and product to meet the needs of different user groups — new users, loyal customers, early adopters, and those who are at risk of leaving.
Track user activity to see how behavior and usage evolve over time. Set specific goals or milestones within user flows to measure adoption and conduct a thorough analysis.
Monitoring these metrics will help you understand how different groups interact with your product, allowing you to make your product improvements.
Get Started on a New Product Adoption Process Today
Using the steps outlined above and tracking the metrics as defined in this article, you can radically improve customer adoption.
Every product team is at a different level of data maturity. Some may be just beginning to integrate their first metrics, while others might be looking to refine and consolidate their current efforts. Regardless of where you stand, it's essential to assess and take action.
By understanding your starting point, you can make small, incremental improvements. This approach allows you to gradually enhance your product adoption strategies. Remember, consistent, focused efforts will contribute to seeing your adoption rates lean in the right direction.
Product Strategy Template
The higher you go up on the Product career ladder, the more strategic skills matter. This template helps you define the why and how of product development and launch, allowing you to make better decisions for your users, team, and company.
Download Template
Updated: July 31, 2025