Imagine you're the captain of a ship navigating the vast sea of user data. Without a compass or map, you'd be lost, right? That's where product analytics comes in! In this guide, we'll chart the course for defining product analytics, its significance, how to implement it, and the key metrics to track. By the end, you'll be a seasoned data sailor, ready to steer your product to success with precision and confidence. Let's set sail!
Product Feature Analysis Template
Understand how your Product’s features stack up to the competition. Identify core features needed to compete against industry-standard products. Then go above and beyond!
Get template
What Is Product Analytics?
Product analytics is the process of collecting, analyzing, and interpreting data related to how users interact with a product. This data-driven approach enables product teams to understand user behavior, preferences, and pain points, which in turn helps in making informed decisions to enhance the product’s performance, usability, and overall user experience.
Product analytics involves using specialized tools and methodologies to gather quantitative and qualitative data about user interactions with a product. By systematically analyzing this information, product teams can gain valuable insights into how users are engaging with the product, identify areas for improvement, and measure the impact of changes or new features.
Importance in Product Management
Product analytics can get complicated! As Jake Canaan, VP of Global Sales Engineering at Quantum Metric said at ProductCon:
If you think data is not hard, you’re probably underthinking it.
Even though it can be hard, you have to soldier through. Product analytics is crucial for Product Managers because it provides a factual basis for making decisions. Digital product management is built on the foundation that data-driven teams can make better decisions leading to better products and better results.
Even when things are going well, it's impossible to know whether a product is a success without analyzing the data. Instead of relying on intuition or anecdotal evidence, Product Managers can leverage data to understand what is working well and what needs improvement. This ensures that product development is aligned with user needs and business goals, leading to better user satisfaction and increased revenue.
Product analytics vs Marketing or Sales analytics
While product analytics focuses specifically on user interactions with a product, it is distinct from other types of analytics:
Marketing analytics: Primarily concerned with data related to marketing campaigns, such as lead generation, customer acquisition costs, and return on marketing investment (ROMI). It helps in optimizing marketing strategies to attract and retain customers.
Sales analytics: Focuses on data related to the sales process, including sales funnel performance, conversion rates, and sales forecasting. It aims to improve sales efficiency and effectiveness.
Product analytics: Centers on understanding how users interact with the product itself. It delves into user behavior within the product, such as which features are most used, where users drop off, and how changes in the product impact user engagement and satisfaction.
Who Uses Product Analytics?
Product analytics is a powerful tool utilized by various roles within an organization to drive data-informed decisions and optimize product performance and meet business goals. Each role leverages product analytics in distinct ways to achieve their specific goals. Here's a closer look at the different roles that use product analytics and how they do so:
How Product Managers use product analytics
Product managers and product analysts focus on holistic product performance and user experience, balancing business goals with user needs. They often look at metrics like feature usage, user retention, and customer satisfaction to guide their strategies. They may also track customer lifetime value (CLV) to understand how different segments contribute to long-term growth.
Decision-making: Product managers rely on analytics to make informed decisions about product features, roadmaps, and priorities. By understanding user behavior and feedback, they can identify which features are most valuable to users and which areas need improvement.
Feature prioritization: Analytics help Product Managers prioritize features based on user engagement and demand. They can see which features are used most frequently and which ones are underutilized.
User insights: By analyzing user data, Product Managers gain deep insights into user preferences, pain points, and overall satisfaction. This information is crucial for enhancing the user experience.
Feature Prioritization Template
Use this feature prioritization template to get clear direction on which features to include and which to leave out.
Download Free
Product analytics for marketing teams
Marketing teams focus on user acquisition, engagement, and retention. They want to see which features trigger conversions for different segments to better understand their target audiences. Product analytics tools with customizable dashboards also allow marketing teams to monitor campaign performance in real time.
Targeted Campaigns: Marketing teams use product analytics to segment users and create targeted marketing campaigns. By understanding which features or aspects of the product resonate with different user segments, they can tailor their messaging and promotions.
User Behavior Analysis: Analyzing how users interact with the product helps marketing teams refine their strategies to attract and retain customers. They can identify key moments in the user journey that drive conversions and optimize their campaigns accordingly.
How Sales uses product analytics
Sales teams focus on closing deals and driving revenue. They use product analytics to understand customer needs, identify potential upsell opportunities, and streamline the sales process.
Identifying High-Value Customers: Sales teams use analytics to identify and prioritize high-value customers who are most likely to convert or upgrade. By understanding user behavior and product usage patterns, they can tailor their sales pitches and strategies.
Optimizing Sales Strategies: Sales teams leverage product data to refine their sales strategies and improve efficiency. They can identify common pain points and objections, allowing them to address these issues proactively.
How CS teams use product analytics
Customer success teams focus on user retention and satisfaction. They use product analytics to monitor user experience, identify potential issues, and provide timely support to enhance the user experience.
Improving Customer Satisfaction: Customer success teams analyze user behavior and feedback to identify areas where customers might be struggling. By addressing these issues, they can improve customer satisfaction and reduce churn. They also rely on retention metrics and user sentiment data to prioritize outreach and training initiatives.
Proactive Support: Analytics enable customer success teams to proactively reach out to users who may need assistance or are at risk of churning. They can provide targeted support and resources to help users get the most out of the product.
How developers use product analytics
Development teams focus on the technical performance and reliability of the product. They use product analytics to ensure the product operates smoothly and efficiently, addressing technical issues that may impact user experience.
Enhancing Product Performance: Engineering teams use analytics to monitor product performance and identify areas for improvement. They can track metrics like load times, error rates, and user interactions to optimize the product’s functionality.
Product Experience Improvements: By analyzing how users navigate and interact with the product, Product Experience, engineering teams can make data-driven decisions to enhance the user experience. This includes refining features, fixing bugs, and improving overall usability.
How UX designers use product analytics
UX designers use product analytics to validate design decisions, identify friction points, and improve usability. By analyzing user flows, click maps, and drop-off rates, they can enhance the product's intuitive feel. Their work often overlaps with product managers and developers, especially during ideation and validation phases of the product management cycle.
User Flow Template
Include design early in the Product process with these two user flow diagram templates.
Get the template
Broader Organizational Impact of Product Analytics
Beyond individual teams, product analytics creates alignment across the entire organization. By offering customizable dashboards and role-based access, product analytics software ensures that each stakeholder—from UX designers and marketers to executives—has access to the metrics that matter most to them. This visibility promotes stakeholder buy-in for product decisions by backing them with real-time data. It also connects efforts across the product management cycle, enabling better coordination between roadmap planning, marketing campaigns, technical implementation, and customer support. By tracking long-term retention metrics like customer lifetime value (CLV), organizations can make more strategic decisions that improve both user experience and business performance.
Product Analytics Metrics
Understanding the different types of metrics used in product data analytics is crucial for Product Managers to gain insights into various aspects of user behavior, product performance, and overall business impact.
Acquisition metrics
Acquisition metrics measure the effectiveness of your efforts to attract new users to your product. They help determine the cost and impact of your marketing strategies. Use acquisition metrics when launching a new marketing campaign to evaluate which channels are most effective in bringing in new users.

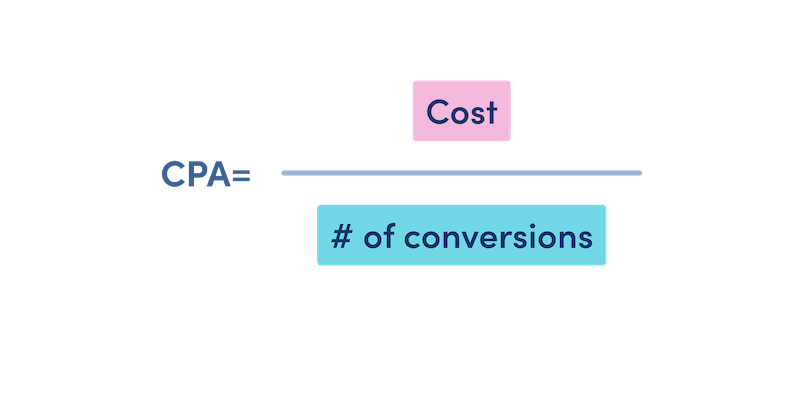
Acquisition metric example: Cost per acquisition (CPA):
CPA is a quantitative metric that measures the cost incurred to bring a new user or customer to your product through marketing efforts. It includes all expenses related to marketing campaigns such as ads, promotions, and other outreach strategies.
Formula: CPA = Total Marketing Spend / Number of New Customers Acquired
Usage: If you spent $10,000 on a marketing campaign and acquired 500 new customers, your CPA would be $20.
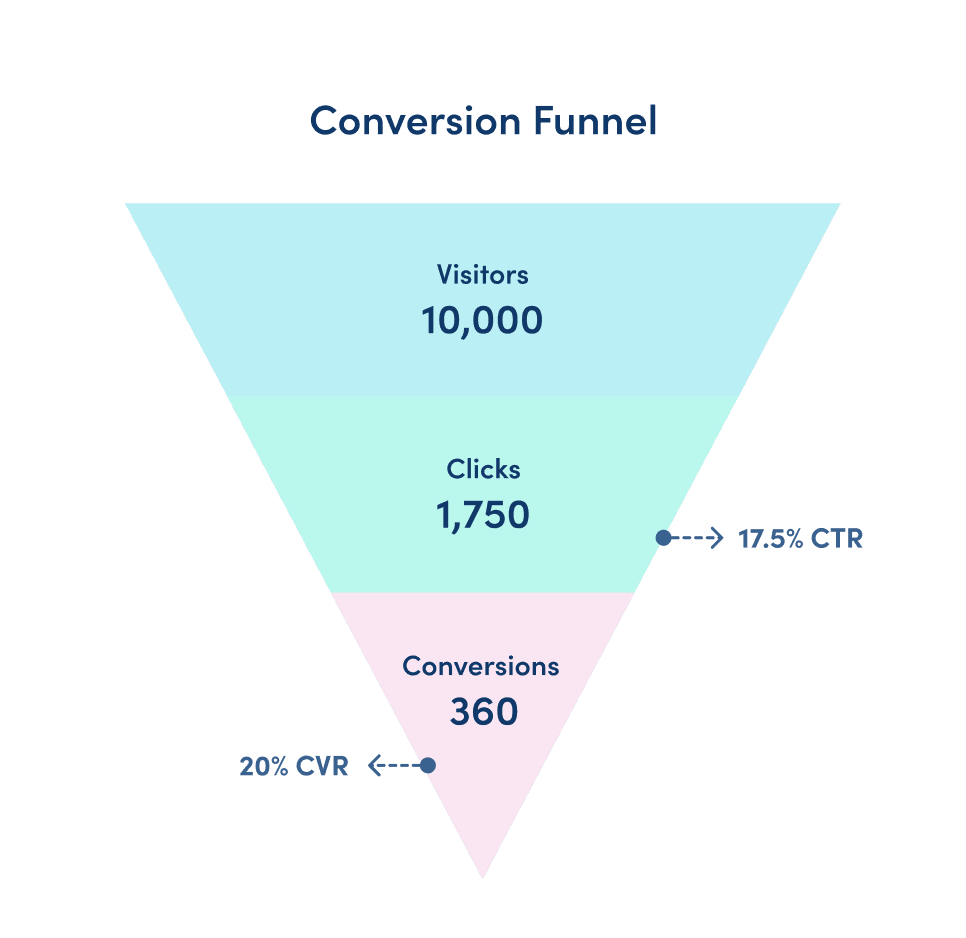
Conversion metrics
Conversion metrics track how well your product turns prospects or users into active users or paying customers. They highlight the efficiency of your product in driving desired actions. Use conversion metrics to optimize user journeys and improve the steps leading to key actions, like sign-ups or purchases.
Example: Conversion rate
Conversion rate calculates the percentage of users who complete a desired action out of the total number of users who were exposed to the opportunity to do so. It is used to evaluate the effectiveness of your product in driving actions such as sign-ups, purchases, or upgrades.
Formula: Conversion Rate = (Number of Conversions / Total Number of Visitors) × 100
Usage: If 1,000 users visit your landing page and 50 sign up for a trial, your conversion rate is 5%.
Engagement and retention metrics
Customer engagement metrics measure how well your product retains users over time and how often and to what extent users interact with the product. They help identify patterns and areas needing improvement. Use retention metrics to assess the effectiveness of updates or new features in keeping users engaged with your product.
Example: Retention rate
Retention rate tracks the percentage of users who continue to use your product over a specified period. It helps to measure user loyalty and satisfaction, indicating long-term engagement with your product.
Formula: Retention Rate = (Number of Retained Users / Number of Users at Start of Period) × 100
Usage: If you start with 1,000 users and 700 are still active after a month, your retention rate is 70%.

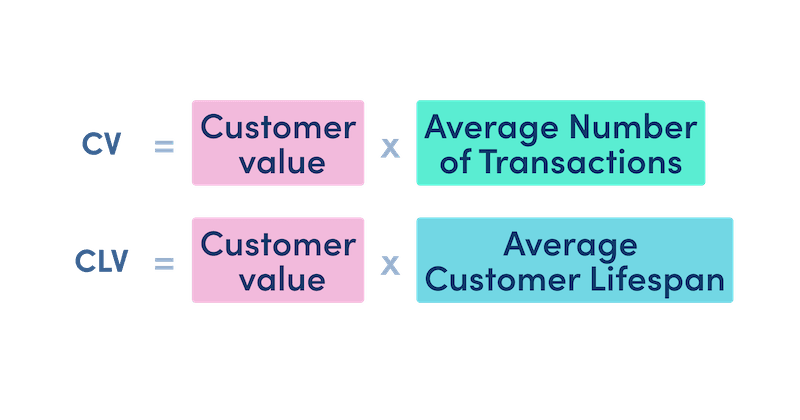
Revenue metrics
Revenue metrics focus on the financial performance and profitability of your product, measuring the revenue generated per customer and overall business impact. They help in understanding the long-term value of your customers. Use revenue metrics to evaluate the effectiveness of pricing strategies and to identify high-value customer segments.
Revenue metric example: Customer lifetime value (CLV)
CLV estimates the total revenue a business expects to earn from a customer throughout their relationship. It takes into account the average purchase value, frequency of purchases, and the expected duration of the customer relationship.
Formula: CLV = (Average Purchase Value × Purchase Frequency × Customer Lifespan)
Usage: If the average purchase value is $100, customers purchase twice a year, and the average customer lifespan is 5 years, the CLV is $1,000.
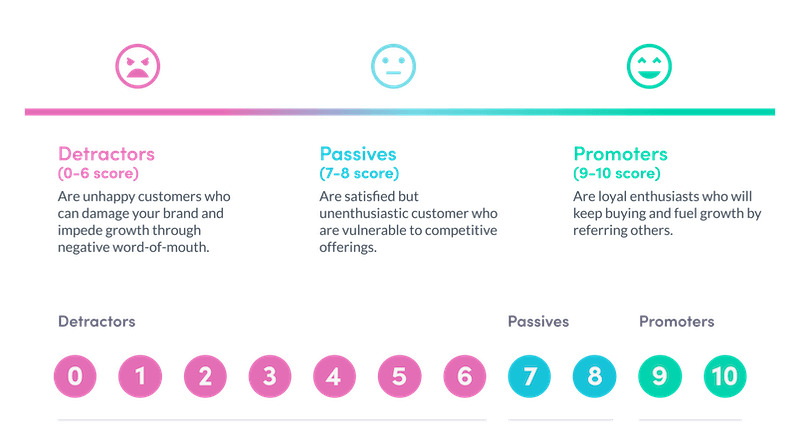
Customer satisfaction metrics
These metrics gauge your users’ relationship with your product, reflecting overall user sentiment and loyalty. They help identify strengths and weaknesses in the user experience. Use customer satisfaction metrics after launching a new feature or update to gather feedback and make necessary improvements.
Example: Net promoter score (NPS)
NPS gauges how likely users are to recommend your product to others. It is based on survey responses that categorize users into promoters, passives, and detractors, providing insight into overall customer satisfaction and loyalty.
Formula: NPS = % Promoters − % Detractors
Usage: If 70% of respondents are promoters and 10% are detractors, your NPS is 60.
Honing Focus: Types of Product Analytics
One thing is for certain: if you try to track everything, you’ll end up tracking nothing. Product Managers need to be clear about what type of analytics they need based on their objectives. Different types of analytics require different metrics, frameworks, and approaches. Here is a detailed but by no means exhaustive list of product analytics types:
Product Development Analytics
Tracks metrics related to the efficiency and effectiveness of the product development process. Used by development and Product Management teams to optimize workflows and resource allocation.
Sprint Analytics
Tracks the progress and efficiency of development sprints, including velocity and burndown charts.
Defect Analysis
Monitors and analyzes bugs and issues reported during development.
Code Quality Metrics
Evaluates code quality through metrics such as code coverage, complexity, and maintainability.
Cycle Time Analysis
Measures the time taken from the start of development to the delivery of a feature.
Resource Allocation Analysis
Analyzes how development resources (time, personnel) are distributed across various tasks and projects.
Backlog Analysis
Evaluates the state of the product backlog to prioritize tasks and manage workload.
Feature Usage Metrics
Tracks which features are most and least used, helping to prioritize future development efforts.
Deployment Frequency
Monitors how often new code is deployed to production, indicating the pace of development.
Customer Feedback Loop Analysis
Analyzes the integration of customer feedback into the development process to ensure user needs are being met.
Product Feature Analysis Template
Understand how your Product’s features stack up to the competition. Identify core features needed to compete against industry-standard products. Then go above and beyond!
Get templateProduct Experience Analytics
Measures the overall user experience and satisfaction with the product. Used by UX and product teams to increase engagement and improve usability.
Event Tracking
Monitors specific user actions and events within the product to analyze behavior.
Usability Testing Metrics
Evaluates the ease of use of a product through user testing and task completion rates.
Session Replay Analysis
Analyzes recorded user sessions to understand user behavior and identify pain points.
Onboarding analysis
Time to First Value measures how quickly a user gets value from the product after starting to use the product.
Heatmaps and Clickmaps
Visualizes where users click, scroll, and spend the most time on a page to understand interaction patterns.
Path Analysis
Studies the common paths users take through a product to identify optimal flows and bottlenecks.
Customer Journey Mapping
Maps the entire user journey to identify critical touchpoints and potential areas for improvement.
Task Success Rate
Measures the percentage of users who successfully complete specific tasks within the product.
Time on Task
Tracks the amount of time users spend on specific tasks, indicating ease or difficulty of use.
Drop-off Analysis
Identifies where users abandon processes or tasks, helping to pinpoint areas that need improvement.
In-App Feedback
Collects real-time user feedback within the app to understand user experience and issues.
Free Customer Journey Map
Put yourself in your customers’ shoes to find the problems in your user experience (and uncover opportunities to solve them).
Download here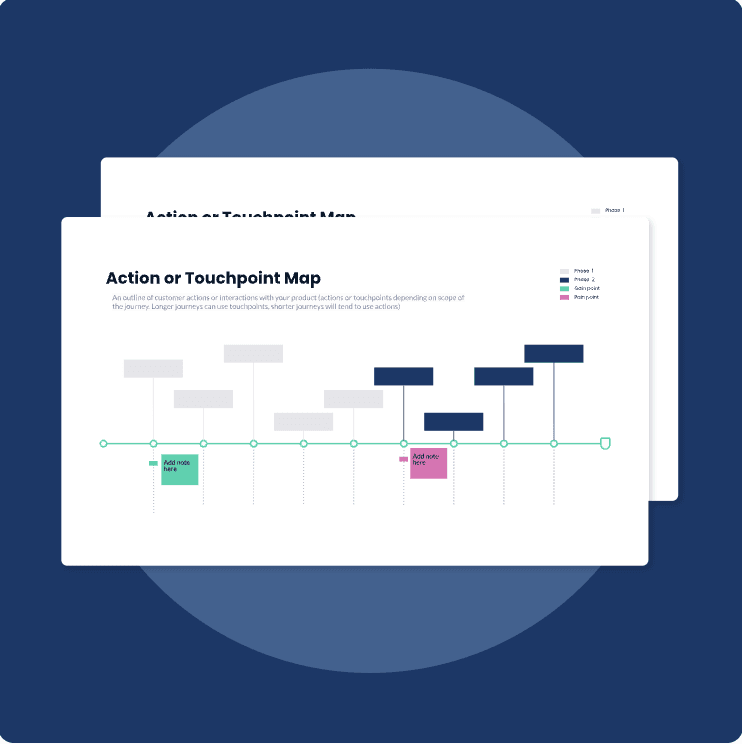
Product Performance Analytics
Defines metrics related to the performance, reliability, and scalability of the product. Used by engineering and operations teams to ensure optimal system performance and user experience.
Operational Metrics
Tracks system performance, uptime, and response times.
Scalability Analysis
Evaluates how well the product handles growth in users and usage.
Load Handling Capacity
Concurrent User Support
Load Testing Metrics
Assesses the product’s performance under various levels of stress and load.
Peak Load
Stress Point
Business Financial Analytics
Focuses on the financial performance and economic impact of the product. Used by finance and executive teams to assess profitability and financial health.
Revenue and Sales Analytics
Analyzes income generated from product sales, including ARR (Annual Recurring Revenue) and MRR (Monthly Recurring Revenue).
Customer Lifetime Value (CLV)
Measures the total revenue expected from a customer over their relationship with the product.
Cost of Customer Acquisition (CAC)
Calculates the cost of acquiring a new customer.
Profit Margin Analysis
Evaluates profitability by comparing revenue to costs.
Customer and Market Analytics
Analyzes customer behavior and market trends to identify opportunities and threats. Used by marketing, sales, and strategic planning teams.
Market Trend Analysis
Analyzes market trends to identify opportunities and threats.
Competitive Analysis
Compares product performance and features against competitors.
Customer Segmentation
Divides the customer base into segments based on various criteria (demographics, product interactions, etc.).
Product Comparison Template
Winning products get to the core of a user need—and then solve it better than the competition. Use this template to identify your user need and evaluate other players in the market.
Get template
User Engagement Analytics
Measures how users interact with the product to gauge engagement levels. Used by product and marketing teams to improve user retention and engagement.
Active Users
Measures daily, weekly, and monthly active users (DAU, WAU, MAU).
Session Duration
Tracks how long users stay engaged with the product in each session.
Feature Usage Analysis
Evaluates which features are used most frequently and which are underutilized.
Retention and Churn Analytics
Evaluates how well the product retains users and identifies reasons for user attrition. Used by customer success and product teams to improve retention rates.
Cohort Analysis
Tracks groups of users over time to understand retention patterns.
Churn Rate Analysis
Measures the rate at which customers stop using the product.
Retention Rate
Analyzes the percentage of users who continue to use the product over a given period.
Conversion and Acquisition Analytics
Analyzes how effectively the product converts prospects into users and optimizes acquisition strategies. Used by marketing and sales teams.
Conversion Rate Optimization (CRO)
Focuses on improving the percentage of users who complete a desired action.
Funnel Analysis
Analyzes user drop-offs at each stage of the conversion funnel.
A/B Testing
Tests different variations of a feature or interface to determine which performs better in terms of conversions.
Customer Feedback and Sentiment Analysis
Collects and analyzes user feedback to gauge sentiment and satisfaction. Used by customer support and product teams to improve user satisfaction.
NPS (Net Promoter Score)
Measures customer loyalty and satisfaction.
Sentiment Analysis
Analyzes customer reviews and feedback comparing the percentage of negative to positive feedback in order to gauge overall sentiment.
In-App Feedback
Collects real-time feedback from users within the product in the form of feature and support requests.
User surveys
Users prompted to provide feedback within the product or through communication at key milestones.
Product Analytics Tools
Product analytics software makes product data analysis and visualization possible, helping businesses make informed decisions based on actionable insights. The following list of tools won Product School’s 2023 Proddy Awards in the Product Analytics category. Proddy winners lead this sector with advanced capabilities in tracking, analyzing, and interpreting complex data sets.
Insight Software: Lightning-fast embedded analytics experiences while accelerating time-to-value – without requiring additional engineering resources.
Mixpanel: Analytics that makes it easy to get answers, make decisions, and show the impact of your product and marketing investments.
Amplitude: Data you can trust and the insights you need to take action and drive growth.
Indicative: A product analytics platform that connects directly to your data warehouse to provide actionable insights across the entire customer journey — without SQL or a single line of code.
LogRocket: Identifies exactly where your customers are struggling the most with AI-first session replay and analytics.
Choosing the right product analytics tools and software
Selecting the right tools is vital for effective implementation. When choosing a tool, consider factors such as:
Ease of Use: How intuitive is the tool for your team? Do a free trial if you can.
Integration: Can it easily integrate with your existing systems and data sources? Consult your platform and data team for answers.
Scalability: Will the tool scale as your product and data needs grow? The free version might work for now, but is it a long-term solution?
Cost: Does the tool fit within your budget? Will it still fit within the budget if you scale?
How to Implement Product Analytics: Example of a Product Analytics Framework
Let’s move from the theoretical to the practical using a scenario from the legendary company Dropbox. In the following example, we’ll show how Dropbox might go about conducting product analytics to reduce churn during the onboarding process.
Setting Objectives
Dropbox, a known cloud storage solution provider, faced challenges with user retention, particularly after the initial trial period with their premium plan. One of the things that makes Dropbox legendary in the product space is their approach to Product-Led Growth (PLG). Because their business model is product-led, they need the product to do the heavy lifting of delighting the customer, keeping them engaged, and turning the customer into a product ambassador through recommendations and collaboration with other users.
With this in mind, their primary objective with this analytics endeavor was to understand user behavior during the trial phase and identify key factors causing users to convert to paying customers. They structured their goal using the SMART framework—ensuring it was specific, measurable, achievable, relevant, and time-bound—to keep the analytics effort tightly focused and outcome-driven.
Choosing a type of Product Analytics
Dropbox decided to employ product experience analytics to get a comprehensive view of user interactions and satisfaction. This included various methods to measure overall user experience and identify areas for improvement:
Event Tracking: To monitor specific user actions within the app, such as file uploads and sharing.
Session Replay Analysis: To analyze recorded user sessions and understand behavior and pain points.
Onboarding Analysis: To measure how quickly users achieve their first meaningful interaction with the product.
Heatmaps and Clickmaps: To visualize where users click, scroll, and spend the most time, aiding in understanding interaction patterns.
Drop-off Analysis: To identify where users abandon processes or tasks.
In-App Feedback: To collect real-time user feedback within the app during the onboarding process and whenever users opted not to sign up for a paid plan.
Deciding which metrics to track
Now they needed to hone in on the right metrics to track. The following metrics can provide excellent Product Experience insights:
Event Tracking: Feature Engagement Rate, Activation Rate
Session Replay Analysis: Drop-off Rate, Conversion Rate
Onboarding Analysis: Time to First Value, Activation Rate
Heatmaps and Clickmaps: Click-through Rate (CTR), Scroll Depth
Drop-off Analysis: Drop-off Rate, Churn Rate
In-App Feedback: Net Promoter Score (NPS), Customer Satisfaction Score (CSAT)
Event Instrumentation
For the analysis that Dropbox wanted to do*, they needed to instrument event tracking using analytics software. This involves defining events, implementing tracking code, and ensuring data is collected accurately. Events can include actions such as button clicks, page views, form submissions, and more.
*Feature Engagement Rate, Activation Rate, Drop-off Rate, Conversion Rate, Churn Rate, and Click-through Rate (CTR).
Steps to instrument events:
Define Events: Identify the key user actions you want to track. This could be anything from signing up for a newsletter to completing a purchase.
Implement Tracking Code: Add tracking code to your product to capture these events. This often involves working with your development team to ensure the code is correctly implemented.
Test and Validate: Ensure that the events are being tracked accurately. This involves testing the implementation and validating the data to ensure it reflects real user behavior. Collaborating across teams—particularly Product, Engineering, and Data—ensures shared understanding of events, minimizes redundancies, and builds accountability around roles and responsibilities in data governance.
Collecting Feedback
For customer satisfaction metrics like Net Promoter Score (NPS) and Customer Satisfaction Score (CSAT), Dropbox would need to ask its customers directly to give their opinion.
Feedback collection steps:
Create a simple survey asking users: "How likely are you to recommend Dropbox to a friend or colleague?" on a scale of 0 (not likely) to 10 (extremely likely).
Trigger the NPS survey at key touchpoints, such as after a user has been using the paid plan for a month, or after they have completed a significant task like sharing their first file.
Integrate in-app pop-ups to collect responses directly within the product using in-built features from their product analytics tools like Mixpanel or Amplitude.
Ensure compliance with internal data usage policies and security protocols when collecting and storing feedback, especially if user identifiers are included.
Data analysis and visualization
Once their events were instrumented and data collected, the next step was to analyze and visualize the data to extract actionable insights. To help start to break down the data they’ve collected, they used the following methods:
Segmentation: Break down data by different user segments (e.g., new vs. returning users) or by role (e.g., admin vs. contributor) to uncover nuanced usage patterns.
Funnels: Analyze user journeys to identify drop-off points and optimize conversion paths.
Cohort Analysis: Track groups of users over time to understand retention and engagement trends.
Visualization Tools:
Dashboards: Data visualization tools like Tableau, Microstrategy, or built-in features of analytics tools to create interactive dashboards.
Charts and Graphs: Visualize key metrics using charts and graphs to easily identify trends and patterns.
Implementation and results
After setting up these tools, Dropbox began tracking the identified metrics and analyzing user behavior. They discovered that users who engaged with the file-sharing feature within the first week were significantly more likely to convert to paying customers. Armed with this insight, they revamped their onboarding process to highlight file-sharing capabilities early on. Additionally, they introduced in-app tutorials and targeted email campaigns to guide new users through the setup process.
As a result, Dropbox saw a 20% increase in user retention rates after implementing these changes. The improved onboarding experience helped users quickly realize the value of the service, leading to higher engagement and satisfaction. The company also established long-term strategies to monitor retention trends over time and adjusted governance policies to ensure consistent data accuracy and usage.
By systematically setting objectives, choosing the right type of product analytics, deciding on relevant metrics, and selecting appropriate software tools, Dropbox successfully enhanced user retention and achieved its business goals.
Dive into Product Analytics with Free Resources
Product analytics empowers Product Managers to make data-driven decisions, optimize user experiences, and drive business success. By understanding and implementing the right metrics, tools, and strategies, you can gain valuable insights into user behavior and continuously improve your product. Get started leveraging product analytics today with certifications, books, and tools to unlock the full potential of your product and ensure lasting user satisfaction.
Product Analytics tutorials
Product School offers a FREE online Product Analytics course in addition to our eBook, The Product Analytics Economy, also free to download. See, there’s no excuse not to be data-driven!
FREE Product Analytics Micro-Certification
Are you struggling to translate data into decisions? Become the data-savvy Product Manager every team need with our free micro-certification in Product Analytics.
Enroll Now
Updated: December 31, 2025