In June 2025, a Deloitte survey found that one-third of generative AI users had already encountered incorrect or misleading answers (1). In other words, a model can score high on accuracy in lab tests yet still deliver answers that erode user trust in the real world.
For AI product managers (AI PMs), this reveals a hard truth: traditional ML model evaluation metrics like accuracy or F1-score, although important, are no longer enough. A model that’s “95% accurate” can still fail your users if it’s too slow, biased, inconsistent, or prone to bizarre errors.
Modern AI products demand a new stack of evaluation metrics. One that puts trust, safety, and user experience on equal footing with model performance.
AI User Flow Template
Essential steps applied to real-world examples from AI product management break down a complicated process into clearly defined flows from the initial entry point to the generated output.
DOWNLOAD FOR FREE
Why AI Model Evaluation Is Critical for PMs
In practice, AI evaluations (evals) are how you prove an AI tool, an AI agent, or RAG system is reliable and continuously improving. It’s the language of trust.
They let product managers (especially AI PMs, technical PMs, and data PMs) move beyond gut feel. Writing good evals is rapidly becoming the defining skill for AI product managers, just like owning the test suite is for great engineers.
The urgency? AI systems are probabilistic and opaque. Without rigorous evals, teams fall back on anecdotes or “quick sanity check.” Just think of how many times your team has glanced at a few outputs and declared them fine.
That doesn’t cut it anymore. PMs can’t rely on feel tests; they need systematic model evaluations to earn stakeholder confidence. Consider that most users won’t report subtle AI errors. They’ll just stop using your product. Evaluating ML models gives you a quantitative safety net, catching quality issues before users do.
Evals create a common language between PMs, engineers, and executives
AI evaluation metrics turn fuzzy concepts like “helpfulness” or “fairness” into trackable metrics. This is critical for building trust internally. If your stakeholders don’t trust the metrics you present, they won’t invest in scaling the AI.
Model evaluation, done right, demonstrates that the product is improving in ways that matter (not just that the model’s test accuracy ticked up by 1%).
In short, 2025’s reality is that evals are to AI PMs what A/B testing and product analytics were to digital PMs a decade ago. They are mission critical. They are how you validate progress and de-risk product innovation in an AI-driven world.

From ML Model Accuracy to Trust
It’s easy to get impressed by a model that scores 95% accuracy on a benchmark. But once it’s in the hands of real users, those same “high-performing” models can stumble. Because benchmarks test ideal conditions. Products live in the messy, unpredictable world of human behavior.
That remaining 5% of errors? It’s rarely random. It’s often where your model fails specific groups of users, misreads context, or produces something no one can trust.
Traditional ML metrics like accuracy or recall tell you whether a model works. But they don’t tell you whether it’s safe, fair, or consistent enough to ship.
Think about it this way:
Accuracy measures correctness.
Trust measures reliability.
Users stick around only when they get both.
When models move from research to production, that difference becomes huge. A “correct” answer that takes too long, reads as biased, or feels inconsistent can destroy confidence in seconds. It’s why leading AI product managers and product teams now talk about trustworthiness as the real benchmark.
Trust isn’t just about getting the answer right. It’s about how the model behaves when it’s wrong (whether it fails gracefully, explains itself, and recovers quickly). It’s also about how predictable, respectful, and stable those interactions feel over time.
In 2025, accuracy is table stakes. Trust is the differentiator.
Model Evaluation Metrics Taxonomy for AI Products
To understand where accuracy falls short, we need a broader lens. This section introduces the key dimensions of AI evaluation. It introduces the metrics that capture speed, fairness, robustness, and more.
Our goal is for you to know what to watch beyond just whether the model is “right.”
1. Accuracy and core performance metrics
The key question here is this: Does the model work at all?
That’s what traditional accuracy metrics are great at. They tell you, in a clean, quantitative way, how well your model is performing on a defined task and dataset. They’re the backbone of AI evaluation, but they just shouldn’t be the whole story.
For AI product managers, these metrics are your starting line, not your finish line. You use them to compare model candidates, catch regressions, and communicate a baseline level of quality before you ever ship to users.
Key metrics to track:
Accuracy: The simplest metric on the list. It shows what fraction of predictions are correct. Useful when classes are balanced and all mistakes are equally costly. If your model is classifying documents as “spam” vs “not spam” and the dataset is roughly 50/50, accuracy is a reasonable first view.
Precision and recall: Precision tells you “when the model says yes, how often is it right?” Recall tells you “out of all the true yeses, how many did we catch?” These matter when the cost of false positives and false negatives is asymmetric. Think fraud detection, medical triage, or moderation. Missing one bad case (low recall) is very different from flagging too many good ones (low precision).
F1-score: The harmonic mean of precision and recall. It gives you a single number when you care about both and don’t want to optimize one at the expense of the other. For many classification tasks with imbalanced data (like rare-event prediction), F1 is a more honest summary than raw accuracy.
Log loss (cross-entropy): Instead of just asking “was the prediction correct,” log loss asks “how confident was the model and was that confidence justified?” Models that are confidently wrong get penalized heavily. This makes log loss a powerful metric when your product relies on probability outputs or risk scoring, not just yes/no decisions.
ROC-AUC / PR-AUC: These evaluate how well your model separates classes across all possible thresholds. ROC-AUC (area under the ROC curve) is useful when classes are relatively balanced; PR-AUC (precision–recall AUC) is better when positives are rare. For PMs, these curves are practical tools when you need to choose thresholds that reflect business trade-offs (e.g., “flag more fraud at the cost of a few extra false alarms”).
Under the hood, these metrics all answer a similar question: given a labeled dataset, how well does the model reproduce the ground truth? That’s essential for model selection and offline benchmarking. You’ll use them to:
Compare multiple models or versions on the same task
Detect regressions when you change prompts, data, or architecture
Decide whether a model is “good enough” to move into pre-production testing
But here’s the catch that matters in 2025: accuracy metrics are usually computed on clean, curated datasets under controlled conditions. Your users don’t live there. They live in the messy world of half-written prompts, ambiguous questions, changing data, and edge cases you didn’t anticipate.
So the right mental model for AI PMs is:
Core accuracy metrics (accuracy, F1, log loss, AUC) → tell you if the model is technically sound on a well-defined task.
Product-level metrics (latency, hallucination rate, bias, robustness, UX trust, cost, drift) → tell you if that technically sound model is actually trustworthy and usable in the real world.
You still need accuracy metrics to be competitive and to speak the same language as data scientists. But if you stop there, you’ll ship models that look great on paper and quietly fail your users in production.
2. Latency and throughput in ML model evaluation metrics
Speed is perception. A model may output brilliantly, but if it’s slow, users bail. Latency and throughput measure whether your AI is usable in real time or just for batch tasks.
Key metrics to track:
Average response time (e.g. milliseconds to respond)
Tail latency (95th/99th percentile — worst-case times)
Throughput or requests per second under load
Impact on downstream conversion or task completion rates
When average latency creeps above user tolerance (often ~1 second for interactive features), engagement and product adoption suffer. Tail latency is even more dangerous: even if most users see speed, a few slow responses leave sticky negative impressions.
Throughput tells you whether your system can scale under load. It’s a critical metric once usage grows.
3. UX trust and consistency in AI model evaluation
A model can be fast and accurate, yet still fail if users can’t rely on how it behaves. UX trust is about predictability. It’s the quiet confidence users feel when the AI gives clear, stable, and consistent answers.
These AI model evaluation metrics go beyond correctness. They measure whether the model behaves in a way that users can understand, anticipate, and feel comfortable depending on.
Key metrics to track:
Consistency rate: How often the model gives the same or similar answers to the same question
Determinism score: The level of output variation given identical inputs
Refusal quality: How gracefully the model declines unsafe or off-policy requests
Clarity rating: How often outputs are structured, concise, and understandable to end users
For AI product managers and AI product owners, these numbers tell a story that accuracy can’t. A perfectly correct answer that looks confusing or contradicts an earlier one still damages trust. Internal AI tools, like HR or policy chatbots, live or die by this metric. One inconsistent reply can erase weeks of confidence.
Consistency and clarity don’t just make the AI look polished. They make it feel human in the best sense.
4. Hallucination rate and factuality in model evaluation
Accuracy means little if your AI confidently gets things wrong. Hallucination rate measures how often a model fabricates facts or strays from its source material. It’s one of the most important model evaluation metrics for generative AI.
Users don’t forgive confident mistakes. They might tolerate “I’m not sure,” but not “Here’s the wrong answer in detail.” That’s why tracking factuality is now as vital as measuring precision or recall in traditional ML models.
Key accuracy machine learning metrics to track:
Hallucination rate: The percentage of outputs that contain unverifiable or false information
Factual consistency score: How often responses stay faithful to the retrieved or source data
Citation coverage: The percentage of answers that include valid, checkable sources
Faithfulness error rate: The share of outputs that contradict the given context or reference materials
Measuring this can be tricky, but methods are emerging. One approach is grounded evaluation: have the model answer questions for which you have a known correct answer or a trusted source, and score what fraction of responses are fully correct and factual.
Another approach is to use an automatic checker or a second model to flag likely mistakes. For instance, research in late 2024 found that a “trustworthiness filter” model could review only a small portion of responses (around 20%) yet still catch nearly all of the incorrect ones, leaving fewer than 1% of errors in the remaining answers.
Reducing hallucinations isn’t just about fine-tuning; it’s about architecture. Retrieval-augmented generation (RAG) pipelines, source citations, and internal verification prompts all contribute to more trustworthy outputs.
5. Bias and fairness
Bias and fairness metrics ensure your AI performs equitably across demographics, languages, and other user segments. You want to detect if your model systematically underperforms or behaves inappropriately for certain groups.
Common fairness metrics include:
demographic parity,
equalized odds, and
subgroup performance comparisons.
For example, you might measure approval rates or error rates across gender or racial categories to check for disparate impact.
Here’s the real-world case. An AI credit model might have an overall 90% accuracy, but still assign significantly lower credit scores to women on average. This actually showed in the Apple Card controversy, where women were granted much lower credit limits than men with similar profiles.
Such disparities indicate bias. To monitor this, PMs set up evaluation slices: evaluate the model separately on data subsets (by demographic, language, region, etc.) and track metrics like accuracy, false-positive/negative rates per group. A large gap signals a fairness problem.
For generative AI, bias can also mean harmful or stereotypical content. Metrics like toxicity scores or counts of biased statements per 100 outputs can quantify this. Increasingly, regulators and enterprise customers demand evidence of fairness testing. A balanced evaluation program will include these metrics and define thresholds (e.g., “no more than 1.2x disparity between any two demographic groups’ error rate”).
If your AI outputs content, also evaluate using bias detectors or human raters: e.g., no biased language in a set of generated sentences. Bias metrics aren’t about achieving zero difference (which can be impossible), but about identifying and minimizing unfair gaps before they harm users or violate laws.
6. Robustness and safety in model performance metrics
Even the most accurate model can fail when users push it to its limits. Robustness and safety measure how your AI behaves under pressure (when inputs are messy, unexpected, or malicious). These model performance metrics protect your product’s reputation before something goes wrong in production.
Key checks to include:
Adversarial robustness: How the model handles typos, slang, or intentionally confusing prompts
Jailbreak success rate: How often it outputs restricted or unsafe content when provoked
Policy compliance rate: Percentage of responses that align with your safety and content guidelines
Think of these tests as your “stress workouts” for AI. A robust model should handle everyday chaos (spelling errors, odd phrasing, edge cases) without breaking. A safe model should refuse to do harm, no matter how cleverly asked.
Keep a small but diverse red-team suite of adversarial prompts and rerun it after each model update. If the AI slips even once in a hundred tests, investigate before users find it.
A model that performs perfectly in demos but leaks data, spreads bias, or crashes under noise isn’t production-ready.
7. Cost and efficiency in AI model evaluation
Even a great model becomes unsustainable if it’s too expensive to run. Cost and efficiency metrics make sure your AI can scale without breaking budgets or product experience.
They answer one simple question: how much performance are you getting for every dollar, token, or second spent?
Key metrics to track:
Cost per query: The average price per request (e.g. $0.03 for a 500-token response)
Tokens per output: A quick proxy for model verbosity and API usage
Throughput-per-dollar: How many user requests you can serve per GPU-hour or per $1
Cost per user action: The real bottom line — what it costs to power a single feature interaction
If handling a million queries costs $100K a month, no optimization elsewhere will matter. Comparing models of different sizes can expose easy wins. A smaller, cheaper model might deliver 90% of the quality at a fraction of the cost.
Efficiency also applies to your evaluation process itself. Running large test suites or human reviews can become expensive, so split them into:
Lightweight “smoke tests” for quick daily checks
Full evaluation runs for deeper, less frequent quality reviews
Think of cost metrics as your operational pulse. They keep innovation ambitious, but grounded in reality.
8. Drift and data quality in model evaluation
Even the best models decay over time. User behavior shifts, language evolves, and data pipelines change. This is a process known as model drift. If left unmonitored, drift quietly erodes performance until users notice before you do.
To catch it early, product teams use drift and data quality metrics that reveal when live data no longer looks like what the model was trained on.
Key metrics to monitor:
Population Stability Index (PSI): Measures how input distributions shift over time; a PSI above 0.2 is an early warning to retrain.
KL divergence: Detects subtle distribution changes in continuous features.
Data quality checks: Track missing values, out-of-vocabulary rates, or sudden spikes in anomalies.
Output stability: Compare current output patterns to past ones (e.g. sentiment, length, tone).
A practical setup looks like this: a weekly dashboard that logs PSI values for core inputs, monitors prediction confidence, and flags deviations beyond defined thresholds. Even small shifts (like more multilingual queries or new product terms) can trigger drift.
Think of these metrics as your model’s health tracker. Instead of waiting for accuracy to collapse, you’ll see early signals like “feature X PSI = 0.27” and can act before users feel the impact. Drift monitoring doesn’t just protect accuracy; it preserves trust.
9. Human evaluation in model performance metrics
No matter how advanced automated testing becomes, human evaluation is still the gold standard for measuring quality, nuance, and tone in AI outputs. But human feedback only adds value if it’s collected systematically and consistently.
In practice, that means designing a human eval process that’s as measurable as any other metric.
Key metrics to track:
Agreement rate: How often evaluators give the same rating (aim for >80% consistency).
Rater drift: Whether reviewers become more lenient or strict over time.
Coverage score: How many different user scenarios your sample set represents.
Turnaround time and cost: How quickly and affordably you can collect reliable feedback.
Start with a clear rubric: define what “good” means for your product. Think whether that’s accuracy, clarity, tone, or policy compliance. Then, validate it by having multiple evaluators rate the same examples and compare results. If disagreement is high, tighten the rubric before scaling.
Regularly include calibration examples in each round to catch rater drift. And whenever you use automated scoring or “LLM-as-a-judge,” cross-check it against human scores. The goal isn’t to replace humans, but to make sure your proxies stay aligned with real judgment.
Treat your human eval pipeline like a product management: measure it, refine it, and automate where you can. The more consistent your feedback loop, the faster your model improves.
What are the top 5 evaluation metrics?
The five most critical evaluation metrics for AI products are latency, hallucination rate, bias and fairness, robustness and safety, and drift monitoring. Together, they reveal how fast, truthful, equitable, stable, and reliable your model is in real-world use. They turn technical accuracy into product-level trust.

Core Accuracy Metrics And How To Measure Them
Before we talk about trust, UX, or drift, we still need a way to answer a basic question: does the model work at all?
That’s where classic accuracy metrics come in. They tell you, with actual numbers, how well a model performs on a labeled dataset. As an AI PM, you use these metrics to compare models, catch regressions, and decide whether something is even worth testing with users.
1. Accuracy evaluation metric
Accuracy tells you what fraction of all predictions were correct.
Formula

Where:
TP = true positives
TN = true negatives
FP = false positives
FN = false negatives
Accuracy works well when:
Classes are roughly balanced
All mistakes cost about the same
For example, if your model is classifying emails into “support” vs “sales” and the dataset is close to 50/50, accuracy gives a decent first signal of performance.
When classes are very imbalanced (e.g. 1% fraud, 99% non-fraud), a model can show 99% accuracy by predicting “non-fraud” every time. That’s why you rarely stop at accuracy.
2. Precision and recall
Precision and recall split “how good is the model?” into two more useful questions:
Precision: When the model says “yes”, how often is it right?
Recall: out of all the real “yes” cases, how many did we actually catch?
Formulas
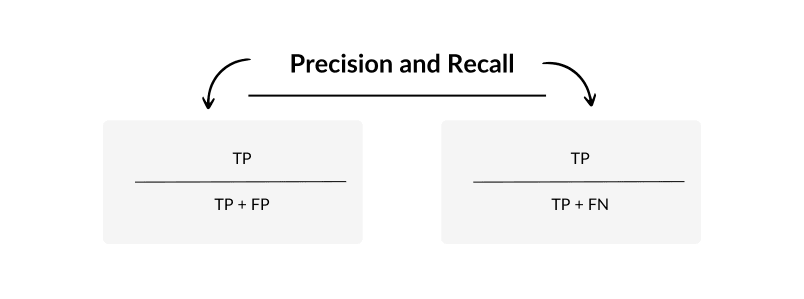
Use precision and recall when the cost of different errors is not the same.
High precision, lower recall: the model is conservative. When it says “fraud”, it is usually right, but it might miss some fraud cases.
High recall, lower precision: the model catches almost all fraud, but flags more false alarms.
As a product manager, you tune precision vs recall based on the product context. Fraud detection, medical screening, safety filters, and moderation all live in this space. The “right” balance is almost always a product decision, not just a data science one.
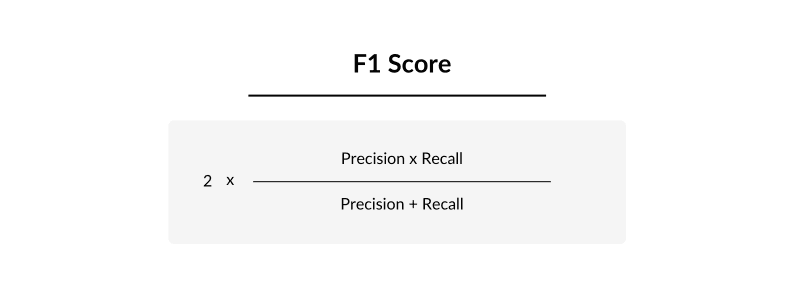
3. F1-score
F1-score combines precision and recall into a single number. It is the harmonic mean of the two.
Formula
F1 is useful when:
Your data is imbalanced
You care about both precision and recall
You don’t want to optimize one at the expense of the other
For many classification problems in production (spam, abuse, rare errors, critical alerts), F1 is a more honest summary than accuracy. As an AI PM, you can think of it as “overall quality when both missing positives and raising false alarms hurt.”
4. Log loss (cross-entropy)
Log loss looks not only at whether a prediction is correct, but also at how confident the model was. It heavily penalizes confident wrong answers.
For binary classification (two classes), the formula is:
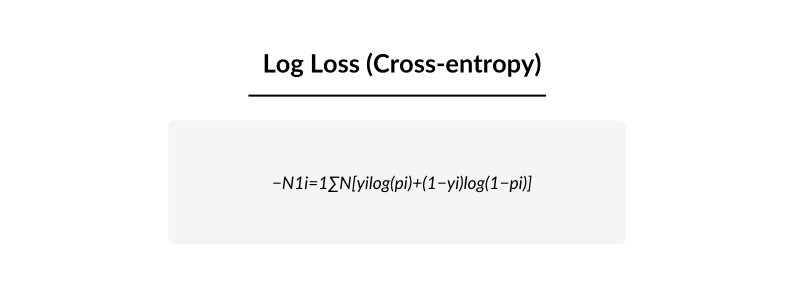
Where:
NNN = number of examples
yiy_iyi = true label for example iii (0 or 1)
pip_ipi = predicted probability that the label is 1
Log loss is low when:
The model is correct
And its probability estimates are well calibrated (e.g. events predicted at 80% really happen about 80% of the time)
It is high when the model is confidently wrong. That makes it especially relevant when your product logic uses probabilities, rankings, or risk scores rather than just a hard yes/no.
As a PM, log loss helps you:
Compare models that output probabilities
Reward models that are honest about uncertainty
Avoid models that “sound” confident but are often wrong
5. Specificity, ROC-AUC, and PR-AUC
Specificity
Specificity tells you how good the model is at correctly rejecting negative cases.

It is the counterpart to recall (which focuses on positives). Specificity matters when false positives are expensive. Think “blocking legitimate users” or “flagging safe content as unsafe.”
ROC-AUC
ROC-AUC (Area Under the Receiver Operating Characteristic curve) summarizes how well the model separates positives from negatives across all possible thresholds. You can think of it as:
0.5 = random guessing
1.0 = perfect separation
It is threshold-independent, which makes it handy when you haven’t yet decided how aggressive your cutoff should be.
PR-AUC
PR-AUC (Area Under the Precision–Recall curve) focuses on precision and recall instead of true/false positive rates. It is especially informative for highly imbalanced datasets where positives are rare.
For PMs, ROC-AUC and PR-AUC are useful when you are:
Comparing model candidates
Choosing thresholds with your data science team
Balancing user experience vs risk (for example, “how many alerts can we show before people start ignoring them?”)
How to Apply AI Model Evaluation Metrics by Context
The relative importance of these metrics shifts depending on your product development context. Let’s explore three contexts (B2B, B2C, and internal tools) and see how evaluation metrics come into play.
B2B (Enterprise): Compliance and Auditability
In enterprise product-led organizations where organizations have a defined AI product strategy, compliance and auditability define trust. For AI products in regulated sectors like finance, healthcare, or insurance, evaluation metrics are about passing audits, proving fairness, and avoiding costly violations.
Here’s how to make your evaluation framework enterprise-ready:
Prioritize fairness and bias testing. Track subgroup performance by demographic, language, or region to uncover uneven outcomes. Even a small bias gap can trigger regulatory scrutiny. Include bias and fairness metrics (like demographic parity or equalized odds) in every release cycle.
Build audit trails. Every decision or recommendation should be explainable and traceable. Evaluate the AI’s explanation completeness: how often it provides sources or reasons for its outputs. A strong benchmark is “at least one valid citation in 90% of responses.”
Test factuality and hallucination rates. For enterprise tools, “mostly correct” isn’t good enough. Design golden datasets for high-stakes use cases (e.g., policy summaries, compliance statements) and track factual accuracy before deployment.
Emphasize reliability over speed. In B2B AI, a slower but consistently correct model often beats a fast, unpredictable one. Monitor response variance and uptime. Consistency matters more than milliseconds.
A practical example: imagine an AI summarizing financial regulations. A single fabricated clause could mislead an auditor and cause real legal exposure. A robust eval suite here might include factuality, bias, and explanation quality.
For enterprise AI product managers, the rule is simple. You’re not optimizing for delight. You’re optimizing for defensibility. Every metric should help you prove your AI tool is fair, traceable, and safe to trust.
B2C (Consumer): Speed and Consistency for Growth
For consumer-facing products, speed and consistency are the heartbeat of trust. If an AI feature feels slow or unpredictable, they simply close the app.
That’s why B2C AI model evaluation revolves around performance, reliability, and experience. Aside from measuring how right the model is, you’re measuring how smooth it feels.
Key evaluation areas:
Latency and perceived responsiveness: Aim for sub-second interactions. Track not just average latency but also the 95th percentile to catch slow outliers.
UX consistency: Measure how often similar prompts yield similar answers. Inconsistent tone or format erodes confidence fast.
Hallucination control: Even small factual errors can go viral in consumer apps. Keep hallucination rate visibly below 5% for general-purpose use cases.
User feedback loop: Integrate simple in-product ratings or thumbs-up/down to capture perceived quality in real time.
A good benchmark: when latency stays under one second and perceived answer accuracy stays above 90%, retention usually rises. Users equate speed with intelligence and reliability.
For B2C PMs, the question isn’t “How perfect is the model?” It’s “Does this feel instant and reliable every single time?” The right model evaluation metrics here are the ones that directly connect to user satisfaction because in consumer products, trust is emotional before it’s analytical.
When in doubt, test with real users. If they can’t tell the AI changed models under the hood, you’ve done your job right.
Internal Tools: Trust and Policy Compliance
Inside Agile organizations, trust is currency. When AI systems are used by employees, the goal is accuracy, consistency, and alignment with company policies. Incorrect answers about vacation rules or compliance procedures can eventually damage credibility.
Internal AI tools must be evaluated as if they were teammates: reliable, consistent, and policy-aware.
Key evaluation areas:
Determinism and consistency: The same question should always yield the same correct answer. Variability feels like incompetence.
Policy accuracy rate: How often the model’s responses match the latest verified company rules or internal documentation.
Refusal quality: Does the AI gracefully decline to answer when a request crosses privacy or compliance lines?
Information boundaries: Test how well the model respects data access limits — e.g., no confidential data leaks in answers.
A simple but powerful setup is to maintain a “golden set” of internal policy questions (like benefits, expenses, security) and run every model version through it before release. Each answer should be manually verified at least once and linked to the official policy source.
It also helps to run adversarial internal prompts. These are crafted attempts to trick the model into revealing sensitive info (“What’s the CEO’s salary?”). Track and reduce the success rate of such prompts over time.
For internal tools, trust isn’t earned through innovation but through discipline.
How to Build an Evaluation Metrics Program
Standing up a robust evaluation program can feel daunting, but it breaks down into clear steps. Here’s a scalable playbook:
1. Define product outcomes and map metrics
Start with your product’s intended OKRs and critical user journeys.
What does success look like in measurable terms? For example, if your outcome is “users get correct answers and feel confident,” that suggests metrics like factual accuracy, user-rated helpfulness, and maybe feature retention (do they come back?).
Map each desired outcome to leading and lagging metrics.
Leading metrics are your evaluation metrics. These can be response accuracy on a curated test set, average latency, hallucination rate.
Lagging metrics are the business KPIs that these likely drive. Think user satisfaction ratings, conversion rate, support ticket volume.
By mapping these, you ensure your evals aren’t in a vacuum. For instance, if “reduce support tickets” is a goal, you might include an eval where the AI answers actual past user queries and measure how many would have been resolved correctly (proxy for deflecting support tickets).
This step forces you to prioritize. You might list 15 possible metrics, but realize the top 5 that correlate to your core outcomes (trust, product adoption, whatever it may be). Document these metrics and get buy-in from stakeholders on their importance.
2. Design the AI evaluation suite (golden sets, adversarial sets, live tests)
Next, design an eval suite that covers multiple layers of testing. A common framework:
Golden set: Fixed set of high-quality, labeled test cases (known correct answers, high-stakes scenarios). It stays the same so you can compare model versions on a stable benchmark.
Adversarial set: Curated edge cases and “red-team” prompts (bias probes, jailbreak attempts, messy inputs, rare dialects). You keep adding new failure modes and track improvement over time.
Dynamic live sampling: Regularly sample a small slice of real traffic (e.g. 0.1%) and score it. This catches drift, new query patterns, and issues that never showed up in offline data.
Canary and A/B tests: Roll new models to a subset of users and compare online metrics (task success, clicks, ratings) against the current model and your offline evals to confirm real-world gains.
A good eval suite balances breadth and depth. It should cover all major aspects: correctness, performance, bias, etc., but also zoom into the most critical scenarios for your app. It’s helpful to create a simple matrix of metric vs. dataset, for example:
“Hallucination rate – test on golden Q&A set”;
“Bias – test on a crafted set of profiles (male vs female names)”;
“Latency – test on 1000 real queries replayed.”
This makes sure you haven’t left gaps. Also, decide on metric calculation methods (e.g., exact match, ROUGE, human score).
Importantly, automate what you can. If you have golden answers, write scripts to compute accuracy or BLEU. For subjective ones, consider using an LLM-as-a-judge carefully. Also, maintain your eval sets under version control; as your product evolves, you’ll update them (but keep old ones to compare historical performance).
3. Balance coverage, cost, and velocity
Not all evals are worth running all the time. There’s a trade-off between coverage (testing everything thoroughly), cost (time and $ to run evals), and velocity (how fast you can iterate). As an AI product manager, you need to balance these across product lines. A practical approach is to tier your evaluations:
Tier 0: Smoke tests – ultra-fast checks (maybe a handful of core cases or automated lint checks) that run on every single model tweak or deployment. These should be cheap and give immediate red flags (e.g. model isn’t entirely broken or slow).
Tier 1: Core eval suite – the main metrics on golden sets and a slice of adversarial tests. This might run in a CI pipeline, taking, say, 30 minutes to an hour. Use this for each significant model update (maybe daily or weekly runs). It covers the most common failure modes and ensures you haven’t regressed on key metrics.
Tier 2: Extended evals – a broader or more expensive set (e.g., full human evaluation on 500 samples, or testing every adversarial case thoroughly, or running on an external benchmark). This might be run for major releases or periodically (bi-weekly or monthly), because it could take multiple hours or involve human labeler costs. It gives a more complete picture, including long-tail issues, and helps you track longer-term improvements.
By tiering, you ensure that day-to-day iteration isn’t bottlenecked by a 12-hour evaluation run, but you also don’t go too long without checking the harder stuff.
You might also have a decision prioritization matrix for when to run what: for example, “If it’s a minor prompt tweak, run Tier 0 and 1. If it’s a new model or major change, run Tier 1 and 2 before full rollout.” Communicate this plan to the team so everyone knows the testing rigor behind changes.
Tooling can help here. Some product teams use evaluation platforms (like Arize, Evidently, etc.) to automate drift and performance monitoring. Others use simple spreadsheets and scripts.
The key is to have consistent reporting. Ideally, you have a dashboard or report that surfaces the key metrics from all your evaluations in one place. That way, before a go/no-go launch meeting, you have an “eval scorecard” showing, for example:
Accuracy = +2% vs last
Latency = -0.1s (improved)
Hallucinations = 3 found in 100 tests (down from 5)
Bias: no regression in group disparity,
Cost per call: up 1¢ (due to larger model), etc.
4. Instrumentation and logging for continuous evaluation
Every strong evaluation program depends on what gets logged. Without data, you’re guessing. With the right data, you’re improving every week. The goal is to capture just enough detail to spot issues early, without drowning in noise or breaching privacy.
Here’s the lean version that works in practice:
Log the essentials: model inputs, outputs, timestamps, latency, token count, and user feedback (e.g., thumbs up/down). Strip or anonymize personal data before storing.
Sample production data: capture 0.5–1% of real user interactions to feed weekly “in-the-wild” evals. Tag which model handled each request for A/B test or canary comparisons.
Monitor drift automatically: calculate simple daily stats (means, top categories) or formal measures like PSI and KL divergence. Anything above your set threshold triggers a retraining check.
Connect outcomes to behavior: if the AI’s suggestion was accepted, log success; if users ignored or reversed it, log failure. It’s how you link evals to business impact.
Set alerts: if latency spikes or confidence drops below your cutoff, page the team. Automatic alerts catch what quarterly reports miss.
Good instrumentation turns product intuition into evidence. You’ll stop arguing about “why it feels off” and start fixing what the logs already revealed.
5. Governance and cadence in model evaluation
Even the best evaluation program fails without a rhythm and an ownership mindset. Governance turns a set of metrics into an actual management system. This is something that keeps teams accountable, traceable, and improving every cycle.
Here’s how to make it work in practice:
Assign clear owners. Every metric or category (latency, bias, hallucinations, drift) should have one accountable owner. PMs usually own the overall eval program, while engineers or data scientists manage specific metric areas.
Set a review cadence. Host a short weekly “AI Quality Review” where the team looks at key metrics, discusses regressions, and decides on fixes. Keep it data-first: one dashboard, one decision per issue.
Use governance artifacts. Maintain model cards (summaries of a model’s purpose, data, and performance) and eval change logs to document every version’s results. These create an auditable history that helps in postmortems and compliance checks.
Create an executive snapshot. A one-page monthly “AI Quality Report” for leadership should show trendlines for core metrics (accuracy, hallucination rate, latency) and highlight next focus areas.
Tie decisions to evaluation data. Model rollouts, deprecations, or retraining should all be based on measurable shifts (e.g. “Hallucination rate down 3%, PSI drift below 0.1) approved for release.”
Good governance makes evaluation part of the product’s heartbeat.
Best Practices for Using AI Evaluation Metrics Right
Evaluation works best when it’s built into your team’s rhythm. Here’s how to keep it sharp, fast, and actually useful.
Tie metrics to user impact. Every metric should link to a clear user journey or business goal; never exist in isolation.
Run evals at three levels. Use offline tests for fast iteration, pre-launch evals for safety checks, and in-production monitors for real-world drift.
Track eval debt. Keep a short list of missing or outdated tests and burn it down each sprint.
Set retrain triggers. Define thresholds (e.g. accuracy < 90% or PSI > 0.2) that automatically flag retraining or fallback.
Keep reports human. Translate metrics into plain English so execs and non-technical partners can act on them.
Revisit metrics quarterly. Retire what no longer matters, add what does — your product and users evolve.
Benchmark cost and speed. Track evaluation coverage time and spend; efficiency matters as much as rigor.
Automate what repeats. Script recurring checks like latency and bias drift so humans can focus on edge cases.
Cross-check human vs. model judgment. Validate any automated “AI-as-judge” scores against human ratings to prevent drift in your eval pipeline.
Short, steady, and visible beats are complex and forgotten. The teams that win with AI are the ones who evaluate consistently.
Treat AI Evaluation Metrics as the Language of Trust
AI products don’t fail because models are inaccurate. They fail because teams stop measuring what really matters. The new generation of evaluation metrics goes beyond precision to capture trust, safety, and real-world reliability.
Building a responsible AI product today means mastering three things:
Knowing which metrics reflect user trust, not just technical accuracy.
Continuously testing and monitoring to catch drift before users do.
Translating model performance into business impact that leaders can understand.
Evaluation metrics are no longer the data scientist’s job alone. They’re the AI product manager’s strategy, the team’s quality compass, and the business’s insurance policy.
Level up on your AI knowledge
Based on insights from top Product Leaders from companies like Google, Grammarly, and Shopify, this guide ensures seamless AI adoption for sustainable growth.
Download Guide
(1): https://www.deloitte.com/us/en/insights/industry/telecommunications/connectivity-mobile-trends-survey.html
Updated: December 8, 2025