Acquiring a new customer can cost five to 25 times more (1) than keeping the one you have. You’ve read this one dozens of times, haven’t you?
Indeed, many teams we talk to invest heavily in chasing leads. But should every takeaway be “retention matters more” or “you’re overspending”? We don’t think so. New customers are vital to growth. As Jay Lee, SVP at NBA, said on The Product Podcast:
Like most product managers, we always want to make sure that we're acquiring new fans and new users into our product. We want to keep them there and keep them engaged. So at a top level, we're focused on using acquisition metrics to drive growth.
Of course, before you pour more into customer acquisition, you should first verify if you’re tracking the right metrics and tracking them properly. In this article, you’ll learn which customer acquisition metrics truly matter in product analytics, how to measure them correctly, and how to use them to drive sustainable growth.
Free User Persona Template
Get to know your users to build the right solution for the right audience.
Get Yours Now
What Are Customer Acquisition Metrics?
Customer acquisition metrics are the numbers that tell you how effectively you’re turning strangers into customers. They track each step of the journey from the first ad impression or website visit all the way to the moment someone becomes a paying user.
What Jay’s quote above highlights is that these metrics help you answer an important question: Is your customer acquisition strategy bringing in new customers, and are you doing it efficiently? These aren’t vanity stats. They shine a light on what’s working (or not) in your acquisition funnel beyond raw signups.
Whether you run a SaaS product, an ecommerce store, or a mobile app, acquisition metrics give you a clear signal of your growth engine’s health.
Are your campaigns attracting the right audience?
Is your website convincing visitors to sign up?
Are you spending $50 in ads to acquire a customer who only pays $20?
The user acquisition metrics will tell you.
The 10 Customer Acquisition Metrics You Should Seriously Consider
When it comes to acquisition, knowing what to measure can shape your entire PLG strategy. Below is a list of 10 essential customer acquisition metrics that offer real insight into how well you’re bringing in new customers (and at what cost).
1. Customer Acquisition Cost (CAC)
Customer Acquisition Cost measures the average cost to acquire a new customer. In simple terms, it’s how much you spend on sales and marketing for each new paying user. This includes money poured into ads, content, sponsorships, sales team salaries, tools, all of it.
Teams track CAC because it directly affects your growth and sustainability. If your CAC is higher than what a customer eventually pays you (their lifetime value), you’re in trouble.
A high CAC might be okay if your pricing or customer lifetime value (CLV) is also high, but if not, you’ll burn cash fast. Keeping an eye on CAC helps you make sure your growth isn’t costing more than it’s worth. It can also reveal if a particular channel is getting too pricey (e.g. your Facebook ads CAC suddenly doubled – time to investigate).
It’s relatively straightforward to calculate if you have your spend and new customer numbers handy. Most teams compute it monthly or quarterly.
Here’s the formula:

CAC=Total Acquisition Spend/Number of New Customers
For example, if you spent $50,000 on marketing and sales last quarter and acquired 1,000 new customers, your CAC is $50. In practice, you might calculate this per channel as well (CAC for Facebook vs. Google Ads vs. organic).
An “ideal” CAC really depends on your business, but one common benchmark is to aim for a CLV-to-CAC ratio of about 3:1. Meaning the lifetime value is three times the cost to acquire. If you’re way off from that (say spending $100 to get a customer who pays only $100 total), you may need to adjust your customer acquisition strategy or product pricing.
2. Conversion Rate
Conversion Rate (CVR) is the percentage of users who take a desired action. In an acquisition context, this often means the percentage of visitors who convert into sign-ups or customers.
You can measure conversion rates at different stages. E.g., what percent of website visitors sign up for a free trial, or what percent of free trial users become paying customers. By monitoring conversion rates, you can identify bottlenecks in your funnel and figure out where users are falling off.
A low conversion rate might signal a poor landing page experience, mismatched messaging, or a signup process that’s too complicated. A high conversion rate indicates you’re doing something right. Your value proposition is resonating, and the path to conversion is smooth.
But beware of surface-level interpretation: a very high conversion rate on a tiny amount of traffic isn’t as great as a decent rate on huge traffic. Sometimes too high a conversion rate could mean you’re attracting only easy-to-convert, low-value users and potentially leaving others behind.
Tracking conversion rate is easy with product analytics tools. Define the “desired action” (e.g., clicked “Sign Up”, completed purchase, etc.) and divide by the total visitors or leads for that step.
Formula:
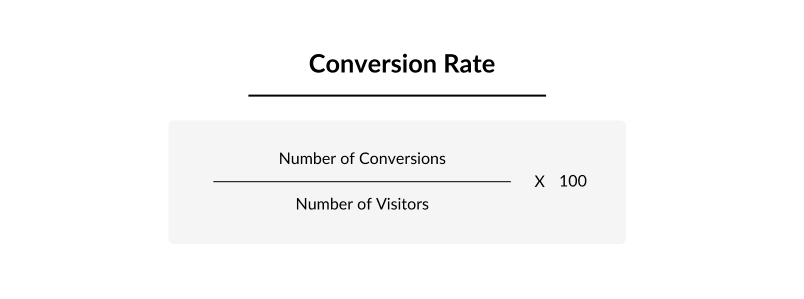
Conversion Rate=Number of Conversions/Number of Visitors×100
If 10,000 people visit your pricing page in a month and 500 start a trial, that stage’s conversion rate is 5%.
You can (and should) calculate conversion rates for each major step of your funnel. It’s also useful to track overall conversion from the first website visit to a paid customer. Improving conversion is often the quickest way to boost acquisitions without spending more on traffic. Even a small uptick can significantly increase your total customers.
3. Bounce Rate
Bounce Rate is the percentage of users who land on your website or app and then leave without taking any further action. Essentially, they “bounce” after seeing just one page.
A high bounce rate can be a red flag for your customer acquisition strategy. It often indicates a mismatch or problem: maybe the page they landed on wasn’t what they expected, or it loaded too slowly, or the call-to-action wasn’t clear.
Most product analytics tools (Google Analytics, etc.) track bounce rate automatically, so it’s easy to monitor. You’ll typically look at it for key landing pages or marketing campaigns.
Formula:
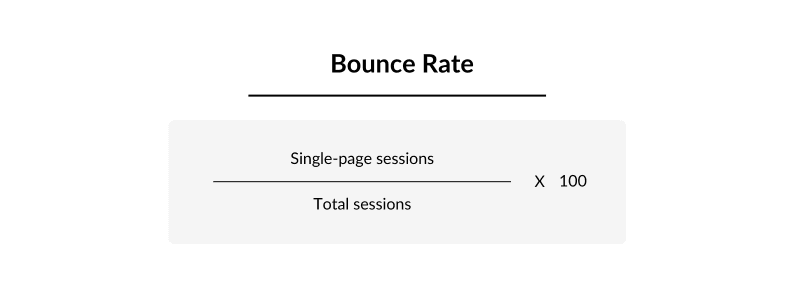
Bounce Rate=Single-Page Sessions/Total Sessions×100%
Why care? Well, lowering the bounce rate means more visitors stick around and potentially convert. If you discover, say, your pricing page has an 80% bounce rate, it’s a sign that something on that page is turning people off. Maybe it’s confusing messaging or an intimidating form.
By improving the page (better content, faster load, clearer value prop), you might turn many of those lost visitors into leads.
Keep in mind that what’s considered “good” or “bad” bounce rate varies by context: a blog article might naturally have a higher bounce rate (people read and leave). A dedicated landing page for an ad should ideally be very low (you want them to click or sign up).
Use bounce rate alongside other metrics. For example, if a channel brings a lot of traffic but with a high bounce, those visitors may not be the right audience, or the landing page may need work.
4. Click-Through Rate (CTR)
Click-Through Rate (CTR) measures the percentage of people who click on your ad, email link, or call-to-action out of those who saw it.
In the acquisition funnel, CTR is commonly discussed for things like online ads (what percent of impressions resulted in a click to your site) or email campaigns (what percent of recipients clicked a link).
CTR matters because it gauges the effectiveness of your top-of-funnel messaging and targeting. A higher CTR means your ad or link was compelling to the audience who saw it; your message, imagery, or offer is resonating. A low CTR suggests either the creative isn’t appealing or you’re showing it to the wrong audience (or sometimes simply that the ad placement is poor).
Formula:
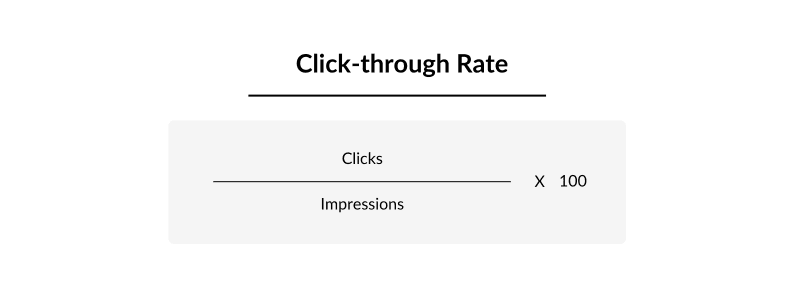
CTR=Clicks/Impressions×100%
For example, if your Google Ad was shown 10,000 times and got 150 clicks, the CTR is 1.5%. In email, if you sent to 5,000 people and 500 clicked, CTR is 10%.
What’s a “good” CTR? It varies by channel. A 2% CTR might be great for a display ad but awful for a highly targeted email. The key is to use CTR as a relative metric: compare how different ads or campaigns perform against each other, and against historical benchmarks.
Also, watch out for deceptive situations: a very high CTR on an ad could just mean you wrote a clickbaity headline. What really matters is whether those clicks convert once on your site. In other words, CTR should be considered alongside downstream metrics like conversion rate to judge quality.
5. Activation Rate
Activation Rate is the percentage of new users who reach a predefined “aha moment” or complete a key set of onboarding steps that signifies they’ve experienced core value from your product.
In a SaaS or app context, activation might be something like: completed profile setup, created their first project, or used the product X times within the first week. It answers the question: of the people who sign up, how many actually get value and become truly active?
This metric is crucial because signups alone are a vanity metric if none of those people actually use the product.
A high activation rate means your product-led onboarding is effective and new users are hitting that value moment that hooks them in. A low activation rate is a big warning sign. It means lots of folks are giving your product a try, but many aren’t sticking around long enough to see why it’s great.
Users who don’t activate are very unlikely to convert to paying customers or become long-term retained users.
Tracking activation rate requires defining what “activated” means for your product (it should correlate with a user who’s likely to continue using it). Once you have that, you simply calculate the percentage of new users in a given period who achieve that.
Example formula:

Activation Rate=Activated Users/New Signups×100
If 1,000 users signed up this month and 700 of them completed the onboarding checklist (or performed the key action), your activation rate is 70%.
Improving this rate often has a leverage effect on everything else. Higher activation means better conversion to paid and better user retention down the line. For instance, according to Paddle, Slack famously found that teams that sent 2,000 messages were far more likely to stick around and eventually pay for the service.
The takeaway: figure out your product’s magic moment and optimize to get users there as fast as possible.
6. Time to First Value (TTFV)
Time to First Value (TTFV), a derivative of time to value, measures how long it takes for a new user to experience a core benefit of your product for the first time.
This could be measured in minutes, hours, or days, depending on the product. For example, on a product management tool, it might be the time until a user creates their first project and invites a team member. On a fintech app, perhaps the time until they make their first transaction.
TTFV is important because the faster a new user gets value, the more likely they are to stick around.
A lengthy or convoluted product onboarding process increases the chance they give up before reaching value. A short TTFV usually leads to higher activation and lower early churn. Basically, impatience is real. If users don’t see something good quickly, they vanish. So keeping TTFV low is key to converting signups into active customers.
To track TTFV, you’ll need time-stamped events (sign-up time and the time they complete the key action). You can then take an average or median for users.

For example, if on average new users take 2 days to reach first value, that’s your current TTFV.
If you find your TTFV is high (or a large portion of users never hit value), that’s a clear mandate to improve onboarding. Perhaps you need to simplify the steps, provide guided tutorials, or highlight the core benefit sooner.
When you reduce TTFV, you not only improve activation rates but also often see a lift in conversion to paid customers. As a rule, remove any roadblocks between a curious new user and the “Holy smokes, this thing is great” moment.
7. CAC Payback Period
CAC Payback Period is how long it takes for a newly acquired customer to “pay back” their acquisition cost. In other words, how many months (or weeks) of revenue from that customer does it take to recover what you spent to get them?
This metric is mostly used in subscription monetization strategy or any model with recurring revenue. It’s expressed in time (e.g., “We recover CAC in 5 months on average”).
This matters because it’s a direct measure of investment recovery and cash flow.
A shorter payback period means you get your money back quickly and can reinvest in acquiring more customers sooner. A very long payback period (say 24 months) might indicate you’re spending a lot upfront and only recouping it over years.
It’s especially critical for startups burning investor money: if payback is too long, you might run out of cash before customers become profitable. On the flip side, if your payback is extremely short (like within the first month), it might signal an opportunity to spend more on growth, since each customer becomes profitable quickly.
Calculating CAC payback can be straightforward if you know CAC and the revenue per customer. Often, teams use monthly recurring revenue (MRR) or gross margin from the customer.
Here’s a common formula:
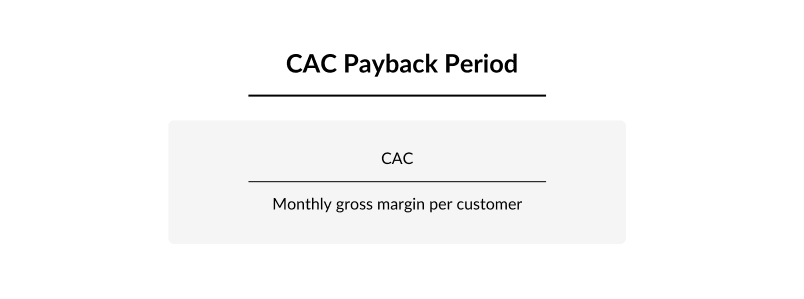
CAC Payback Period=CAC/Monthly Gross Margin per Customer
For example, if your CAC is $120 and your average customer brings $40 in gross margin per month, the payback period is $120 / $40 = 3 months. After 3 months, the customer has “paid back” the acquisition cost, and beyond that, they’re yielding profit.
Many SaaS companies aim for a payback period of under 12 months (so that in the first year, each customer is profitable). Some even target <6 months in fast-growth situations to keep the burn low.
This metric aligns the product teams and finance teams. It ensures that those customers stick around and pay long enough to make the acquisition worth it.
8. Marketing Qualified Leads (MQLs) and Product Qualified Leads (PQLs)
Marketing Qualified Leads (MQLs) and Product Qualified Leads (PQLs) are ways to measure lead quality. I.e., how likely a prospect is to become a valuable customer, rather than just lead quantity.
MQLs are leads that fit your ideal customer profile and have shown interest through marketing engagement. For example, someone who downloaded a whitepaper or filled out a pricing inquiry form and matches your target demographic might be tagged as an MQL. It’s a signal for product marketing teams and sales teams: “this one is worth following up with!”.
PQLs are leads or users who have done specific in-product actions that indicate a strong intent to convert to a paying customer. This is common in freemium or trial models. A user who’s on a free plan but uses the product heavily, that behavior might qualify them as a PQL (meaning a salesperson should probably reach out, or the product should prompt an upgrade). In short, PQLs are usually high-intent users discovered via product usage rather than via marketing alone.
If you simply track “number of signups” or “number of leads”, you might celebrate volume that doesn’t translate into revenue. Tracking MQLs and PQLs forces you to pay attention to quality: are we attracting the right people, the ones likely to become happy customers?
You’ll typically track the count of MQLs/PQLs and also conversion rates related to them (e.g. what percentage of MQLs turn into customers, vs. general leads). Identifying an MQL or PQL requires some criteria and instrumentation:
For MQL, criteria might include job title, company size, or engagement score (like opened 3 emails AND attended a webinar). Your CRM or marketing automation can flag these.
For PQL, you need to define the key in-app events (e.g. “used feature X 5 times” or “invited a teammate”) that correlate with upgrade likelihood. Your product analytics or CRM can then flag when a user meets that threshold.
If you got 500 trial signups this month, but 100 of those hit the PQL criteria (say, they used the product daily for a week), you have 100 PQLs. If 30 of those PQLs convert to paid, that’s a 30% PQL-to-customer conversion rate. This tells the team that those PQL signals are meaningful.
Ultimately, MQLs and PQLs help align marketing, sales, and product teams on a common definition of a “hot lead”.
An MQL can guide sales on who to call first, and a PQL can trigger a targeted in-app message or sales outreach. Many growth teams even compensate or set goals around PQL generation rather than raw signups, because it’s a more reliable predictor of revenue growth.
9. Viral Coefficient (Referral Rate)
Viral Coefficient (sometimes called referral rate or K-factor) measures how well your existing users attract new users. It’s essentially the number of new users generated by each existing user through referrals or word-of-mouth.
If one user invites or inspires two more to join, and those users similarly bring others, you have viral growth.
The viral coefficient is calculated as the average number of invites sent times the conversion rate of those invites becoming new users. For example, if on average each user invites 5 others and 20% of those invites convert, the viral coefficient is 5 * 0.2 = 1.0.
A value above 1.0 means each user brings more than one new user on average. That’s when you get self-sustaining exponential growth. This metric is a game-changer because it captures the power of word-of-mouth and network effects in your acquisition.
A high viral coefficient means your product essentially grows itself without extra marketing spend. This greatly lowers your effective CAC (since referrals are often free or cheap incentives) and can scale incredibly fast. On the other hand, a low or zero viral factor means you rely entirely on direct acquisition efforts (ads, outbound, etc.) to grow.
Tracking viral coefficient requires instrumentation of referrals/invites. Many teams also look at the percentage of new signups that come from existing user referrals as a simpler proxy (e.g. “35% of our new customers this month were referred by friends”).
In fact, Dropbox famously achieved explosive growth by leveraging referrals. They grew 3,900% in 15 months, going from around 100k users to 4 million, by offering extra storage to users who referred friends. At one point, over 35% of Dropbox’s daily signups came from their referral program. That’s the power of a high viral coefficient.
The formula in a simplified form:
Viral Coefficient = Average # of Invites Sent per User x Conversion Rate of Invites
How to Choose the Right Customer Acquisition Metrics
Not every metric matters equally for every business. The best acquisition metrics for you depend on a few key factors:
Your product operating model: A B2B SaaS with a sales team might obsess over product qualified leads (PQLs) and trial conversion rate, whereas an e-commerce brand might focus on website conversion rate and average order value. If you run a subscription-based monetization strategy, metrics like CAC and payback period are critical. Choose metrics that align with how your business makes money.
Your sales motion or product strategy: Are you product-led or marketing-led? In a product-led growth model, you may track signups reaching an “aha!” moment (activation rate) and PQLs. In a marketing-led or sales-led model, you might track marketing qualified leads (MQLs), demo requests, and lead-to-customer conversion. Your metrics should mirror how you acquire customers; whether through viral loops, self-serve signups, or salesperson outreach.
Your funnel’s biggest friction points: Look at where you struggle most. If tons of people visit your site but few sign up, focus on metrics like conversion rate or bounce rate. If signups are plenty but usage is low, watch the activation rate and time to value. Identify the leakiest bucket in your funnel and prioritize metrics around that stage.
Your growth strategy and product goals: If you’re trying to scale efficiently, customer acquisition cost (CAC) and CAC payback period are vital to track ROI. If you’re experimenting with new channels (TikTok, referrals, partnerships), monitor channel-specific metrics (CTR, conversion per channel, etc.) to see what works. For a company banking on virality, the viral coefficient or referral rate is key. Align metrics with what “growth” means for your team.
A good rule of thumb for measuring acquisition is this:
Use a couple of core metrics as your baseline (like conversion rate and CAC). Then layer in other metrics depending on your model and pain points, and always track trends over time or by cohort.
In other words, watch metrics month over month and segment them (by channel, by campaign, by user segment) to spot patterns. Ultimately, the goal is to measure what matters so you can take action that actually improves your customer acquisition.
How to Improve Customer Acquisition Through Metrics and KPIs
Tracking metrics is useless if you don’t act on them. The real value of customer acquisition metrics comes from using them to make product analysis and strategy tweaks that move the needle.
Here’s how to turn data into results, with practical steps that align with the metrics above:
1. Use funnel metrics to find and fix drop-offs in the journey
Your conversion funnel is likely multi-step. From awareness (ad click or visit) to consideration (signup or add to cart) to purchase. Metrics like conversion rate, bounce rate, and specific funnel drop-off rates can show you where prospects disengage.
This is your first clue to improving acquisition: identify the leaky step and plug it.
If you notice, for example, that lots of people click your ad (good CTR) but then 80% bounce on the landing page, the landing page is a problem. If many add items to cart but don’t complete purchase, that’s a checkout issue. This is common in e-commerce, with an average cart abandonment being ~70%.
Map out each stage of your acquisition funnel and calculate the conversion or abandonment at each step. Then target the worst-performing step with an experiment.
If the landing page has a high bounce, try simplifying the design or message to better match the ad. If the checkout has a high abandonment rate, consider adding trust signals, simplifying the form, or offering free shipping.
Many companies also implement remarketing. For example, sending a follow-up email or ad to users who abandoned a cart can recapture some lost sales. The key is to be data-driven and trust product analytics.
Focus your energy on the part of the funnel that will yield the biggest gain if improved.
2. Segment your metrics by channel and audience
Averages can lie. Your overall CAC or conversion rate is a blend of very different sources and customer types.
Smart teams dig deeper. They segment metrics by channel, campaign, or user segment to see the story behind the average. This way, you discover which customer acquisition efforts bring high-quality customers versus which ones just bring in volume that doesn’t stick.
For example, your overall CAC might be $100, but breaking it down reveals organic referrals are essentially free (CAC ~$0) while paid search CAC is $200. Your overall conversion rate is 5%, but on mobile it’s 8% and on desktop 3%. These insights let you reallocate resources.
Here’s what you can do. Break down CAC, conversion, and user retention by acquisition source. Identify at least your top 3 channels (e.g. Google Ads, Facebook Ads, Organic Search, Referrals, etc.) and calculate CAC and LTV for each. Do more of what works and less of what doesn’t.
If organic and referrals are performing best, invest in content, SEO, or referral programs. If a certain paid channel has an acceptable CAC but those users churn quickly, either refine the targeting or consider shifting spend elsewhere.
For instance, Dropbox realized their paid channel was unsustainably expensive and that referrals had a far better ROI. That insight was worth millions.
3. Speed up onboarding to boost activation (and conversion)
Often the biggest drop-off in acquiring active customers happens between sign-up and activation. If your activation rate is low or TTFV is high, many acquired users are floundering early on.
To improve customer acquisition, you need to ensure that once someone signs up, they quickly reach the promised value. This not only improves user retention but also directly impacts how many free signups convert to paid customers.
Actionable move:
Identify the key actions that new users should take in their first day or week (those correlated with long-term usage). Then optimize your product-led onboarding flow around those. This could mean simplifying registration, adding an interactive tutorial, or sending timely nudges (email or in-app tips).
For example, if you know users who upload a profile picture and follow 3 friends in the first session tend to stick around, design the onboarding to encourage exactly that. Many successful SaaS companies analyze their onboarding like a funnel of its own.
Each extra field in a form or each confusing step is an opportunity to drop off. Remove needless steps and get them to the “aha moment” faster.
4. Focus on quality over quantity by using lead qualification metrics
It’s easy to get excited by big top-of-funnel numbers. But if most of them are poor fits who will never convert or will churn quickly, you’re wasting effort. That’s where metrics like MQL and PQL come in handy.
To improve customer acquisition, shift some of your focus from “How many?” to “Are they the right people?”. This might involve marketing targeting, product changes, or product-led sales alignment to prioritize quality.
Here’s what you can do:
Define what a qualified lead looks like for your business (both marketing-wise and product-wise). For marketing, tighten your ideal customer profile and scoring. If you find that small businesses under 10 employees rarely convert, maybe stop spending on that segment and focus on mid-market leads.
Use your MQL criteria to score incoming leads and have sales follow up only with those that hit a score threshold, instead of treating all leads equally.
For product-led growth models, instrument your app to flag PQLs. A user who used your app every day of the free trial and hit the usage limit is a prime PQL might need a push or a personalized offer to convert.
Set up alerts or automated emails for such PQLs, or have your sales team reach out personally (“I saw you’ve been getting a lot of value from our tool – can I help you unlock even more with the Pro plan?”).
By acting on qualification metrics, you ensure your acquisition efforts translate into actual customers. This might mean fewer total leads, but more actual customers. It’s the classic “work smarter, not harder” applied to acquisition.
5. Iterate with A/B tests to lift conversion rates incrementally
Improving acquisition is rarely about one silver bullet feature; it’s more often the result of continuous tweaking and iterative testing. Key metrics like conversion rate and CTR will improve when you experiment with different approaches.
Treat each part of your acquisition funnel as an experiment waiting to happen. Run A/B tests and build prototypes to optimize them. Small changes can yield surprisingly big results over time.
So, to take action, build a testing roadmap for your growth funnel. For instance, if your product page conversion is low, create two variants with different headlines or a different call-to-action button color/text and split the traffic to see which converts better.
Test a shorter signup form versus the current one. Let data drive decisions: if variant B brings a 2 percentage-point higher conversion, roll it out.
Also consider testing price presentations or free trial lengths. Sometimes acquisition falters because of how the offer is structured.
We’ve seen cases where one company finds that removing one required field (phone number) from their sign-up form boosts completion rate dramatically.
According to VWO, Amazon’s one-click checkout famously improved its conversion by streamlining the process. You don’t have to guess what will work – you can experiment and let users “vote” with their actions.
Over time, a culture of continuous product optimization can compound your acquisition gains, turning a 5% conversion into 6%, then 8%, and so on.
6. Pair quantitative metrics with qualitative insights to find the “why”
Metrics will tell you what is happening, but not always why. Improving acquisition sometimes requires digging into the qualitative side: user feedback, session recordings, and customer interviews.
Maybe your metrics show people dropping off at the pricing page. Only by talking to users do you learn that your product pricing is confusing, or they didn’t see a key piece of info. The best growth teams use metrics to identify issues, then qualitative research to understand them. They understand the difference between qualitative and quantitative metrics and use it to their advantage.
Whenever you spot a concerning metric, complement it with some user outreach. This could be as lightweight as using an on-site survey (“What almost stopped you from signing up today?” for those who did sign up, or “What were you looking for?” for those who bounced).
Or, more in-depth, like reaching out to a few users who didn’t convert or who churned quickly. Ask for their candid feedback.
Another approach is to watch recordings or heatmaps to see where people hesitate or get frustrated. For example, a startup noticed lots of users were clicking “Pricing” and then leaving. By interviewing a few, they discovered it wasn’t the price amount scaring them, but confusion over what was included in each plan.
They clarified the pricing page, and conversions improved.
Why Customer Acquisition Metrics Are Your Advantage
Think of acquisition metrics as the diagnostics on your growth engine. Rather than throwing more money into marketing and hoping for the best, you can pinpoint exactly where to tune up.
Maybe your “check engine” light is a rising CAC, telling you to adjust your targeting or pricing. By responding to these signals, you stop flying blind and start building growth on purpose.
In the race to acquire users, data is your turbo boost. While others might blindly scale ad spend or chase vanity metrics, you’ll be methodically improving each part of your funnel.
Over time, that becomes an advantage. You’ll spend less to get more. You’ll attract not just users, but the right users. And you’ll turn more of those first-time visitors into long-term, happy customers.
FREE Product Analytics Micro-Certification
Are you struggling to translate data into decisions? Become the data-savvy Product Manager every team need with our free micro-certification in Product Analytics.
Enroll Now
Updated: October 1, 2025