Most products are pretty decent when it comes to signups. What makes them fail is that people sign up, say ‘not impressed’, then vanish. In fact, around 80–90% of users churn if they don’t see a product’s value in the first week.
That tiny, early moment you capture with product analytics, right after signup, is where user activation happens. It’s when someone stops being a curious visitor and actually becomes a user. If you can spark that shift, growth gets a whole lot easier.
In this guide, we’ll break down what user activation is, why it matters, how to measure it, and the best strategies to get it right.
Download the playbook for free
User Activation: Turning Signups into Loyal Users
A signup just gives someone a ticket to explore. The real win is keeping them engaged long enough to see value in your product. In plain terms, that’s user activation. The shorter the time to value, the better. It means guiding new users through the first steps until they have that “aha” moment and want to stick around.
What is user activation?
User activation is when a new user realizes your product’s value and becomes an active user. It’s that pivotal point where someone moves from just having an account to using the app regularly or even paying for it.
In SaaS, it often means converting a free trial user into a paying customer by ensuring they “get” the product. To put it simply, activation is about helping users use your product long enough to find real value in it.
According to recent data, average activation rates for SaaS products hover around 36%, with a median closer to 30%. That means for every 100 new signups, about 30–36 users reach the activation milestone. Again, this could be completing onboarding, sending a first message, or taking any meaningful action that signals they've “got it.”

What is the difference between user activation and user engagement?
User activation is the moment a new user experiences value for the first time, like completing onboarding or using a key feature. User engagement happens after activation and measures how consistently users interact with the product over time.
Why measure user activation
Activation is a leading indicator of retention. For us, it's now defined as five meetings booked within a timeframe.
— Stephen Hsu, CPO at Calendly, on The Product Podcast
If you don’t track activation, you may miss the biggest leaks in your funnel. When users never reach value, they’re likely to quit. As a result, that hurts user retention and revenue.
Users who fail to activate are more likely to abandon your product, leading to wasted acquisition costs and low satisfaction scores. A low activation rate means high churn and poor ROI.
Measuring activation tells product managers where users drop off so they can fix the user flow and user journey. In Dave McClure’s popular AARRR framework, activation sits between customer acquisition and user retention. It asks, “Are people taking the actions we want them to?”

Here’s a list of reasons why you should measure user activation:
It shows you where users drop off before finding value.
It highlights leaks in the funnel that waste acquisition spend.
It links directly to retention (activated users stick around longer).
It gives clarity on product-market fit by showing if people “get it.”
It helps you design better product-led onboarding flows.
It connects activation to revenue growth (more engaged users convert faster).
It helps teams prioritize improvements based on real user behavior.
6 Effective Customer Activation Strategies
Activation is rarely fixed with a single tweak. It’s the outcome of aligning product design, onboarding, data, and feedback loops. Great teams don’t just guide users through the product — they engineer the first experience around:
Reducing cognitive load
Surfacing value fast
Validating the product’s core promise
1. Interactive onboarding
Most teams think user onboarding is about showing off features. The best product teams know it’s about driving one critical behavior: helping users get value as quickly as possible.
Instead of generic walkthroughs, interactive onboarding should feel like a controlled experiment. Every step should increase the odds that a new user experiences the “aha moment”, the one that statistically predicts long-term user retention.
For Slack, that’s sending a first message in an active workspace. For Notion, it’s creating or customizing a page. For marketplaces like Airbnb, it might be making the first booking or listing.
In practice, you measure success by correlating onboarding flows with downstream retention. If the users who complete your checklist churn at the same rate as those who don’t, your onboarding isn’t solving the real problem. The best product leaders treat onboarding as a living product of its own: continuously tested, iterated, and tied back to revenue.
How do we make the onboarding process more effective? Here are a couple of advanced tactics:
Progressive disclosure: Don’t dump every feature at once. Build a flow that reveals just enough functionality for the user to succeed today, while queuing advanced features for when the user shows intent. Think of it as scaffolding: you help them climb without showing the whole structure.
Event-based onboarding: This is where steps adapt in real time to what users actually do. If a user lingers too long on a step, you trigger contextual help. If they complete a task fast, you skip ahead. This requires cross-functional collaboration between PMs, product designers, and engineers. They should instrument product analytics, run A/B tests, and maintain conditional paths. It’s heavier to build, but it’s what separates “nice tours” from onboarding that moves numbers.
2. Personalization
The rookie mistake in onboarding is assuming every user has the same intent. In reality, different segments enter your product with very different goals.
A startup founder trying out Notion isn’t looking for the same value as a student who just wants a note-taking app. If you run them both through the same vanilla flow, at least one of them will feel the product doesn’t “get them.”
Top product teams fix this with early intent capture. They ask just one or two high-signal questions upfront (role, use case, team size) and then adjust the product experience accordingly. This is not a marketing trick. It’s a product design principle: the shortest path to value is always context-specific.
The advanced play is to think of personalization as a decision tree built on data analysis instead of assumptions. For example:
A B2B SaaS might detect whether the signup email is personal or corporate. Personal users get a solo-friendly flow, while corporate domains trigger team setup nudges.
Marketplaces often look at supply vs. demand intent. Uber asks if you want to “ride” or “drive.” Airbnb asks if you’re hosting or booking. They don’t waste time showing you both.
Even within SaaS, your flow should adjust dynamically. If a user uploads data right away, show integrations next. If they skip, hold off until later.
Engineering-wise, this means building flexible onboarding architecture: conditional steps, user attribute tagging, and event-driven UI states. It’s more effort than a static flow, but it scales better because you’re not treating all users like one persona.
You measure effectiveness by segment-level activation rates. If your personalization is working, different cohorts should converge to similar activation outcomes even though their paths differ. In other words, students and founders might have different first-run flows in Notion, but both should hit activation at healthy rates.
The biggest pitfall? Over-personalization that creates maintenance chaos. The art is in choosing a few high-leverage forks in the road, not tailoring every pixel.
3. Quick wins
The fastest way to lose a new user is to make them work hard before they see value. That’s why quick wins matter. They compress the gap between signup and the first meaningful success. Done right, they don’t just prove the product works, they anchor the user’s belief that it’s worth coming back.
Most teams confuse quick wins with shallow “congratulations” screens. In reality, they’re about identifying the keystone action that has the highest predictive value for retention, and then engineering the shortest possible path to it.
For Canva, that’s getting someone to publish their first design in minutes. For Zoom, it’s hosting the first meeting successfully without technical friction.
The expert move is to think in terms of time-to-value curves. Instead of optimizing only for the average, map the distribution. How many users get to value in 5 minutes, 30 minutes, 24 hours? Best-in-class products flatten that curve so most users cross the line almost immediately.
Engineering teams often support this by:
Pre-loading sample data so the product isn’t an empty shell at signup (Notion’s starter templates, Mixpanel’s demo dashboards).
Building one-click defaults so users can skip configuration hell and jump straight to outcomes (e.g. Shopify’s default storefront theme).
Using “progressive commitment” so the user gets a payoff before giving away too much information (Duolingo lets you start a lesson before you even create an account).
You measure impact not just by raw activation rates, but by speed-to-activation. If you cut the time to first value from days to minutes, you’ll usually see downstream user retention improve dramatically.
The nuance: a quick win must connect to your product’s long-term value, not just a dopamine hit. Otherwise, users bounce after the initial high. The best PMs distinguish between novelty (fun but fleeting) and utility (a repeatable reason to return).
4. Incentives and gamification
Incentives and gamification work when they reinforce core product behaviors, not when they add fluff on top. Too many teams throw badges or points at users without asking: does this action correlate with long-term retention or revenue? If the answer is no, the incentive risks distracting users instead of activating them.
The expert approach is to tie incentives directly to value-creating behaviors.
Dropbox didn’t give users badges for inviting friends; it gave them extra storage space, which directly increased product utility. Duolingo doesn’t award streaks for opening the app; it rewards completing lessons, which is the behavior most predictive of continued engagement. The lesson here is to reward what matters most in your retention model.
Another advanced tactic is to think of incentives across time horizons:
Short-term nudges: encourage immediate actions like finishing onboarding or setting up a first project.
Medium-term reinforcers: streaks, milestones, or cumulative rewards that keep users coming back for weeks.
Long-term alignment: benefits that scale as users invest more (e.g. Dropbox storage or LinkedIn’s visibility rewards for completing profiles).
From a development perspective, product managers need to be wary of building systems that are expensive to maintain or easy to exploit. Gamification should be event-driven, tied into product analytics, and flexible enough to evolve. The best teams regularly prune incentives that lose impact and double down on the ones that demonstrably improve retention curves.
Measurement is straightforward but critical. Look at whether incentivized behaviors correlate with reduced churn and higher lifetime value. If they don’t, the incentives are cosmetic. Strong evidence of success is when the cost of the reward is outweighed by the increased revenue from longer-lasting or paying users.
The pitfall most teams fall into? Designing incentives around what’s easy to track, not what’s strategically important. A good data product manager knows the difference between engagement vanity metrics (likes, clicks, badges) and activation milestones that define user success.
5. Data and feedback loops
Activation is about continuously learning where users succeed and where they drop off. The best teams treat onboarding and activation as living systems, not one-time projects.
The expert play here is building tight customer feedback loops between user behavior data and product decisions. Product analytics tells you what users are doing; feedback tells you why. Without both, you risk optimizing for the wrong thing.
On the quantitative side, strong teams instrument every step of the activation funnel with event tracking. They don’t measure “onboarding completion” as one blob. They break it into micro-events like account creation, first project, first integration, first team invite. Then, they correlate each step with long-term retention.
This helps uncover the true bottlenecks. For example, you might discover that skipping the “invite teammates” step reduces day-30 retention by 40%. That insight can’t come from averages.
On the qualitative side, teams run just-in-time feedback collection. They ask users for a two-second pulse when they stall, or trigger micro-surveys after key actions.
Instead of broad NPS emails weeks later, they capture friction in the exact moment it happens. Tools like Hotjar or Pendo can overlay this into the product, but the real advantage comes from having a PM and researcher actually review the sessions and cluster the patterns.
The advanced move is combining these into closed-loop experiments. Suppose analytics shows a 60% drop at step three of onboarding. The team runs usability tests, finds that users don’t understand the value of that step, then ships an A/B variant with clearer copy or a different sequence. Within a week, they see whether the change improves activation downstream. Over time, this cycle compounds.
A sign of maturity is when activation metrics are visible across teams. Engineers see the same data, designers see the same data, and product leadership knows whether changes are moving the needle. That transparency makes activation a shared responsibility rather than a siloed metric.
The pitfall: drowning in data without product prioritization. Great teams focus only on the few behaviors proven to predict retention, then build their feedback loops around those. Everything else is noise.
6. Follow-up engagement
Even the best onboarding won’t capture everyone. Some users will drift away before activation, and this is where smart follow-up comes into a play. The goal is to design context-aware re-engagement that nudges users at the right time, with the right message, through the right channel.
The advanced playbook here includes:
Segmentation: Identify where users dropped off (never onboarded, half-completed, or activated but lapsed) and tailor nudges accordingly.
Timing: Test for product-specific “golden windows.” For many SaaS products, the 24–72 hour mark is critical.
Channel orchestration: Layer in-app prompts, emails, and push notifications with escalation rules instead of hammering every channel at once.
Value-first messaging: Remind users of progress or utility, not just absence. (“Your first report is waiting,” “One lesson left to keep your streak.”)
Measurement: Track reactivation rate, but also compare reactivated users’ retention to organic users to ensure they stick.
Critically, every follow-up must tie back to the product’s real value. Dropbox warns when you’re running out of storage. Duolingo protects your streak. That precision is what separates meaningful engagement.
Key User Activation Metrics
These are the core metrics that product teams track to understand whether new users are truly engaging with the product and moving toward long-term retention.
1. Activation rate
Activation rate measures the percentage of new users who reach your chosen activation milestone. This might be completing user onboarding, setting up their first project, or sending a first message. It’s whatever signals that they’ve hit value in your product.
Teams track this rate because it’s the clearest sign of whether people are sticking around long enough to experience the benefit you promise. A low activation rate is often the first red flag for churn.
For example, if only 20% of signups complete onboarding, it’s a sign your flow is confusing or the product’s value isn’t obvious.
It’s simple to calculate:

Activation Rate = Activated Users ÷ Total New Users × 100
So if 400 out of 1,000 signups complete onboarding, your activation rate is 40%. Benchmarks vary by industry, but in SaaS, strong teams usually aim for 40–60% or higher.
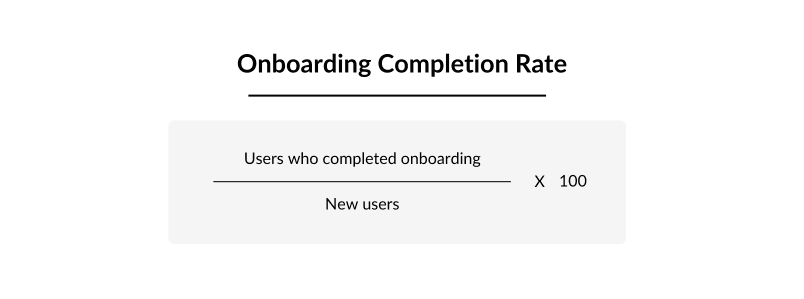
2. Onboarding completion rate
Onboarding completion rate looks specifically at how many users finish your product-led onboarding flow. While activation might be tied to a product milestone, onboarding completion shows if users can even get to that point.
A high drop-off here suggests friction in the very first minutes. Think of products that ask for too much information up front or throw too many features at users before they’ve seen value. A completion rate below 50% is often a warning sign.
To improve it, teams often shorten sign-up forms, add progress indicators, or break the process into quick, digestible steps.
3. Time-to-value
Time-to-value (TTV) measures how long it takes a new user to get their first “aha” moment. The shorter this period, the higher your chances of keeping them around.
Why it matters: users are impatient. If someone signs up and doesn’t see immediate benefit, they’ll leave. That’s why products like Canva let you create a design in minutes instead of making you sit through tutorials first.
Here’s the formula:

TTV = Date of first value achieved - Date of user onboarding
Teams usually calculate TTV as the average time from signup to activation milestone. Best practice is to aim for minutes or hours, not days. Long TTV is one of the strongest predictors of churn.
4. Feature adoption rate
The feature adoption rate shows how many new users start using a specific core feature. This is especially important if your product has multiple functions, but only a few drive real stickiness.
For example, in Slack, sending a first message is critical. They know lurking doesn’t lead to activation. In Dropbox, uploading the first file matters far more than browsing the interface. Tracking product adoption helps you see whether people are finding and using the features that anchor them to your product.
Formula:

Feature Adoption Rate = Users of Feature ÷ Eligible Users × 100
Teams often track this by feature, by cohort, and over time to see which ones actually contribute to user retention.
5. Retention and churn
We're also connecting the dots. What we found is that people who connect to integrations retain better. Vimeo is a subscription business. We look at churn and retention very carefully, and we see that integrations lead to greater retention.
— Justin Kim, VP of Product at Vimeo, on The Product Podcast
As you see in Kim’s statement, activation is about whether people come back. User retention measures how many activated users return after a set time (day 1, day 7, day 30). Churn measures how many users stop using the product.
Strong retention after activation is the ultimate sign you’ve nailed the product experience and critical user journey. If people activate but still drop off quickly, it suggests they either didn’t see enough value or your product didn’t become part of their routine.
Here’s the formula:

Retention rate = Customers at the start - Customers at the end / Number of customers at the start
Across the SaaS industry, a 5% annual churn rate is often seen as a healthy benchmark, implying that 95% of customers are retained each year. That equates to less than ~1% monthly churn, though SMBs may experience higher rates (3–7%).
For SaaS, retention curves that flatten instead of dropping steeply are usually a good sign. Think of Duolingo, where streaks and gamification encourage long-term return, versus apps where usage falls off after a single try.
Examples of great user activation
Some well-known products nail user activation. Their onboarding sets new users up for quick success:
Duolingo – When you sign up, Duolingo immediately puts you into a short gamified language lesson based on your chosen language and goals. Users see how learning works from the first screen and earn rewards, which makes the app’s value clear right away.
Dropbox – New users get simple tasks (like installing the desktop app or inviting friends) with the promise of extra free storage. This incentive drives them to complete setup steps and deeply engage with the product. People activate fast because each action has a clear, tangible reward.
Canva – The graphic design tool gives users a quick, hands-on tutorial. When you sign up, you can create your first design while learning the basics. By mixing education with action, Canva makes sure new users understand and value the product immediately.
LinkedIn – The professional network walks new members through useful actions: completing their profile, adding connections, and following companies or groups. Each step highlights benefits (like better visibility or relevant content), which shows users why they should engage. The clear value in these steps helps users activate.
Slack – New workspaces have an interactive tour driven by Slackbot messages. The onboarding chats guide users through key features (like sending messages, setting status, or adding apps) in a friendly, hands-on way. This conversational approach helps people learn and start using Slack instantly.
These examples show that well-designed product-led onboarding, clear value props, and small rewards can turn a signup into a habit.
The Importance of User Activation
User activation is where all your acquisition spend either pays off or gets wasted. You can buy traffic, optimize funnels, and generate endless signups, but unless new users reach that first moment of value, they’ll churn before they ever matter.
The companies that win are the ones who obsess over reducing time-to-value, designing frictionless onboarding, and personalizing the first-run experience. They track the right metrics, test relentlessly, and treat activation as a living product, not a one-off project.
For product managers, this is the real leverage point. Every improvement you make here compounds downstream: higher retention, stronger revenue, lower churn.
Free Customer Journey Map
Put yourself in your customers’ shoes to find the problems in your user experience (and uncover opportunities to solve them).
Download here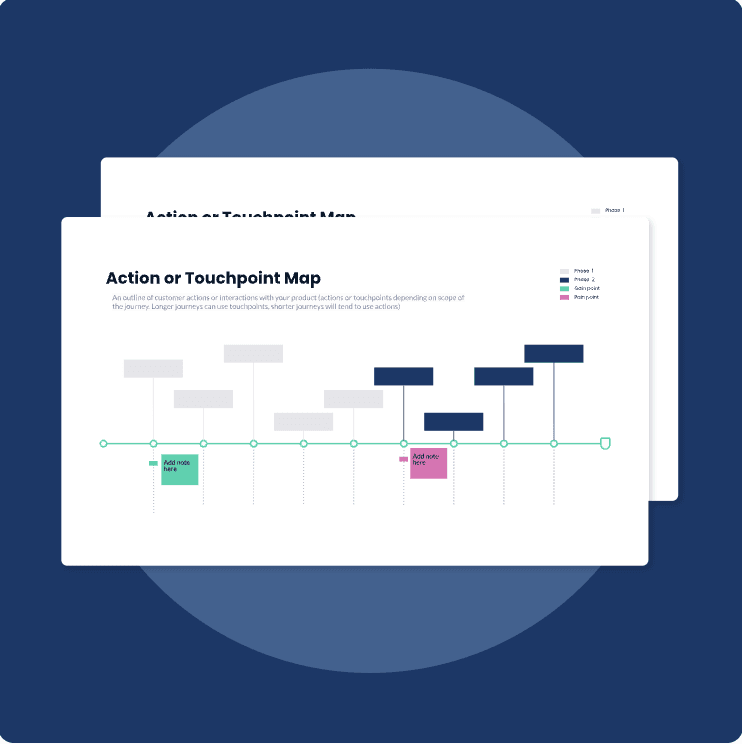
Updated: October 8, 2025