Keeping customers is harder than getting them. It’s also way more valuable.
But here’s the catch. Most teams track growth and acquisition like hawks and barely glance at who’s slipping out the back door. Customer retention metrics, an essential part of product analytics, are the panacea. They show you what’s really going on after the signup, the sale, or the first aha moment.
In this piece, we’ll walk through the key metrics you should be watching, how to calculate them, and how to use those numbers to actually keep more customers around.
Growth Metrics Cheat Sheet
Master the metrics you need to keep things moving 'up and to the right'! Our Growth Metrics Cheat Sheet covers 45 metrics to measure success at every stage—from acquisition to revenue and referral.
Get the Cheat Sheet
What Are Customer Retention Metrics?
Customer retention metrics are the numbers that tell you whether your users are sticking around or quietly walking away. They track how long people stay, how often they come back, and how much value they bring over time.
In simple terms, these metrics help you answer one big question: are we keeping the customers we worked so hard to earn?
They’re not just vanity stats. They reveal what’s working (or not working) beyond the first click, signup, or purchase. Whether you’re running a SaaS platform, ecommerce store, or subscription service, retention metrics give you the clearest signal of long-term health.
How to choose the right customer retention metrics
Not every metric matters equally for every business. The best retention metrics for you depend on:
Your business model:
A company with a subscription monetization strategy might care deeply about churn and lifetime value, while an e-commerce brand might prioritize repeat purchase rate.Your product usage pattern:
Daily-use apps should look at daily active users and time between sessions. For low-frequency products, long-term user retention or repeat purchase may be more telling.Your customer journey stage:
If customers churn early, focus on onboarding metrics and early product adoption. If they leave later, look at usage drop-off or support ticket trends.Your growth strategy:
Trying to expand within accounts? Focus on net revenue retention. Trying to reduce acquisition costs? Lifetime value becomes more important.
As Ariel Bardin, the President of Technology at Warner Music Group, put it on The Product Podcast:
You want to talk impact? Translate features into business levers. Growth, margin, new revenue, retention. That’s what wins executive alignment.
The right retention metrics don’t just help you measure success—they help you frame it in terms your leadership cares about.
A good rule of thumb to measure customer retention:
Use retention rate and churn as your baseline
Layer in engagement, loyalty, and revenue-based metrics depending on what you offer and where your pain points are
Track metrics over time and in cohorts to spot trends, not just spikes
Ultimately, the goal is to track the right things, so you can take action that moves the needle.
The 15 Customer Retention Metrics You Should Seriously Consider
Not all metrics are created equal and when it comes to retention, knowing what to measure influences your product strategy. Below is a list of the most useful customer retention metrics that offer real insight into how well you’re keeping your customers.
Customer Retention Rate (CRR)
Churn Rate
Customer Lifetime Value (CLV)
Repeat Purchase Rate
Net Promoter Score (NPS)
Time Between Purchases / Usage Frequency
Customer Engagement Score
Product Adoption Rate
Monthly Active Users (MAU) / Daily Active Users (DAU)
Customer Satisfaction Score (CSAT)
Revenue Retention Rate (Gross & Net)
Average Customer Lifespan
Cohort Retention
Support Ticket Volume Over Time
Onboarding Completion Rate
Let’s break down what each of these tells you and why they matter.
1. Customer Retention Rate (CRR)
Customer Retention Rate measures the percentage of customers you’ve kept over a specific time. It’s one of the most direct indicators of whether your product or service is delivering consistent value.
Teams should consider tracking CRR because it reveals how well you're building long-term relationships. If your CRR is low, it’s a signal that your retention strategy needs attention, whether that’s product onboarding, support, or product-market fit.
It’s relatively easy to track using most analytics tools, CRMs, or even with basic spreadsheet data, as long as you know your customer counts at the beginning and end of a given period.
Here’s the formula:
CRR=(Customers at End of Period−New Customers Acquired Customers at Start of Period)×100

2. Churn Rate
Churn Rate tells you the percentage of customers who stopped doing business with you over a specific time period. It’s essentially the flip side of retention, and just as important.
The chart below shows a typical retention curve. It starts high after signup and gradually flattens out. This visual makes it easy to see how churn and retention are two sides of the same coin.
You should care about this metric because high churn means lost revenue, stalled growth, and possibly deeper issues with your product or user experience. It helps teams understand where customers are dropping off and whether your retention efforts are actually working.
Tracking churn is generally easy if you have access to customer count data. Most CRMs, analytics tools, or subscription platforms will let you calculate it automatically or with a simple formula.
Here’s the formula:
Churn Rate=(Customers Lost During Period/Customers at Start of Period)×100

Smaller churn rates are ideal, but even healthy companies have some churn. The key is knowing your baseline and improving from there.
3. Customer Lifetime Value (CLV)
Customer Lifetime Value estimates how much revenue a customer will generate for your business over the entire duration of their relationship with you. It’s a long-view metric that connects retention directly to revenue.
This one matters because it helps you understand how much each customer is worth and how much you can afford to spend on acquiring and keeping them. Teams often use CLV to justify investments in customer success, support, and retention initiatives.
CLV is a bit more complex to track than basic retention or churn, especially if your pricing model is variable. But most product analytics and revenue platforms support it or you can calculate it manually with average values.
Here’s a common formula for subscription or recurring revenue businesses:
CLV=Average Revenue Per User (ARPU) × Average Purchase Frequency x Average Customer Lifespan

If you’re running a transactional business, the formula can be adapted using average order value and purchase frequency. Either way, the goal is the same — maximize what each happy customer brings over time.
4. Repeat Purchase Rate
Repeat Purchase Rate tells you what percentage of your customers come back to buy again. It’s a simple but powerful indicator of how well you're turning first-time buyers into loyal ones.
Teams should track this because it's a direct reflection of customer satisfaction and perceived value. If people return, it means they trust your brand. That’s far more cost-effective than constantly chasing new users.
This metric is easy to calculate with any e-commerce or transactional data platform, and many CRMs have this built in.
Here’s the formula:
Repeat Purchase Rate=(Customers with More Than One Purchase/Total Customers)×100

It’s especially useful in DTC and ecommerce, but can also apply to SaaS or services where users “renew” or upgrade in meaningful ways.
5. Net Promoter Score (NPS)
Net Promoter Score measures how likely your customers are to recommend your product or service to others, using a simple 0–10 scale. While it's technically a sentiment metric, NPS is widely used as a proxy for customer loyalty and future retention.
It’s worth tracking because customers who recommend you are usually the ones who stay. NPS also helps you spot detractors early, those unhappy users who are at high risk of churn but may not have said anything yet.
It’s relatively easy to collect using in-app surveys, email prompts, or customer feedback tools. Most tools will calculate the score for you, but here’s the basic formula if you need it:
NPS=%Promoters − %Detractors

Promoters are those who score 9–10, passives score 7–8, and detractors are 0–6. The higher your NPS, the stronger your word-of-mouth growth and retention potential.
6. Time Between Purchases / Usage Frequency
This metric tracks how often a customer returns to make a purchase or use your product. For some businesses, that means tracking days between transactions; for others, it's about session frequency or feature usage.
It’s important because a shrinking time gap usually signals stronger engagement and satisfaction, while longer gaps may hint at fading interest or potential churn. Knowing how often customers should be coming back gives you a benchmark to act on when they don’t.
Tracking this is fairly simple if you have timestamped activity or purchase data in your analytics platform or database. Most tools can pull this with a custom report or basic SQL query.
There’s no universal formula, but a typical version looks like this:
Time Between Purchases=Sum of Time Between Orders / Number of Gaps Between Orders
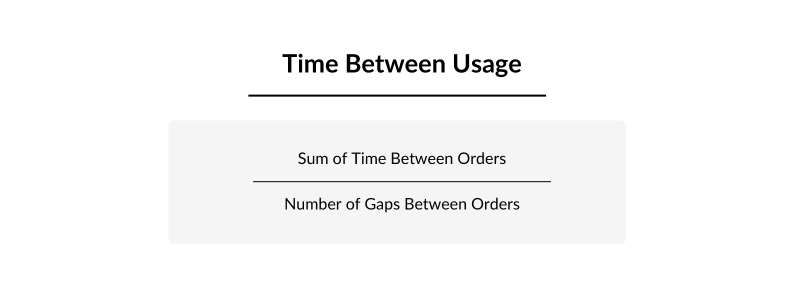
For SaaS or apps, you might look at average number of logins or sessions per week or month. The key is to define what “healthy frequency” looks like for your product and track who’s drifting away.
7. Customer Engagement Score
Customer Engagement Score is a custom metric that reflects how actively and deeply a customer is interacting with your product. It’s usually built from a mix of actions like logins, feature usage, session length, content consumed, or any signals that matter to your specific business.
Teams should consider this metric because engagement tends to be a leading indicator of retention. Customers who stop engaging don’t just vanish overnight, they fade out. A clear score helps you catch that early and take action before they churn.
It’s a bit more involved to set up, since you’ll need to define what “engagement” means for your product and assign weights to different actions. Most product analytics platforms let you build this kind of custom scoring.
There’s no standard formula, but it generally looks like:
Engagement Score=(X×Logins)+(Y×Core Feature Use)+(Z×Session Time)+…
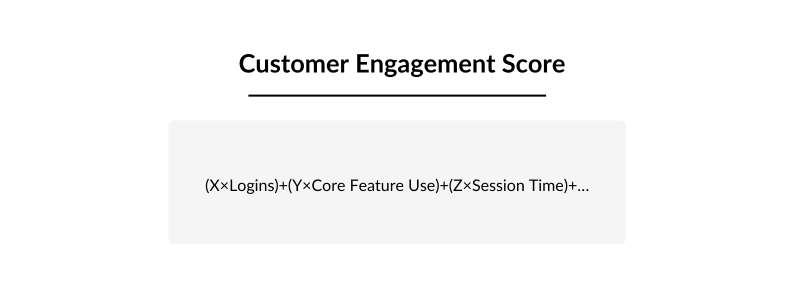
The goal isn’t to find the “perfect” formula, but to build a useful signal that helps you identify your most active, at-risk, or high-potential users.
8. Product Adoption Rate
Product Adoption Rate measures how many of your users are actually using key features or completing key actions within your product. It’s a direct indicator of whether your product is delivering value and how quickly users are reaching their “aha” moment.
You’ll want to track this because high product adoption is usually a precursor to strong retention. If customers never fully adopt your core features, they’re unlikely to stick around long-term.
Justin Kim, a VP of Product at Vimeo, put it bluntly on The Product Podcast:
We’re also connecting the dots with what we found is people who connect to integrations, they adopt better. ... Vimeo is a subscription business. We look at churn and retention very carefully, and we see that integrations lead to greater adoption.
The lesson? Adoption is about using the right features that drive stickiness.
It’s relatively easy to track if you’ve defined what your primary features or success actions are. Most product analytics tools like Mixpanel, Heap, or PostHog can help you monitor adoption trends automatically.
Here’s a basic formula for the adoption of a specific feature:
Product Adoption Rate=(Total Number of Signups/Total Users)×100

You can also apply this to onboarding milestones, usage of new releases, or even entire product lines. The more meaningful the feature, the more telling this metric becomes.
9. Monthly Active Users (MAU) / Daily Active Users (DAU)
MAU and DAU track how many unique users are actively engaging with your product on a monthly or daily basis. They’re foundational metrics for understanding product stickiness and user engagement over time.
As Tricia Maia, Head of Product at TED, explained on The Product Podcast:
For our site and our app, it's about how many people are coming, how frequently they're engaging with us. We look at monthly active users, talk starts, talk completes, and retention. Retention has been a core area of focus of ours over the years.
For many teams, MAU and DAU are a pulse check on user loyalty.
These metrics matter because they show whether people are coming back consistently or just dropping in once and disappearing. High DAU/MAU ratios, especially in consumer or SaaS products, usually point to strong user retention and habit formation.
They’re also easy to track with any product analytics tool. Most platforms will show active users out of the box, and you can segment by time frame, behavior, or cohort.
Here’s how you calculate the DAU/MAU ratio (a popular retention signal):
DAU/MAU Ratio=(DAU/MAU)×100

A DAU/MAU ratio above 20% is considered good for many B2B products. For social or consumer apps, 50%+ is often the benchmark. It’s not about the number itself, it’s about what it tells you over time.
10. Customer Satisfaction Score (CSAT)
Customer Satisfaction Score measures how happy customers are with a specific experience, usually right after a support interaction, purchase, or product use. It’s a quick, focused way to capture sentiment while it’s still fresh.
This metric is worth tracking because satisfied customers are more likely to return, renew, or recommend you. While CSAT isn’t a long-term retention metric on its own, it gives you immediate feedback on the parts of the journey that influence loyalty.
It’s easy to collect using short surveys (e.g. “How satisfied were you with your product experience?” rated from 1 to 5). Most customer support or feedback tools offer CSAT tracking built in.
Here’s the standard formula:
CSAT=(Number of Positive Responses (4 or 5)/Total Responses)×100

CSAT helps you zoom in on critical moments, like onboarding, feature use, or customer support, and make changes that directly impact retention.
11. Revenue Retention Rate (Gross & Net)
Revenue Retention Rate shows how much recurring revenue you retain from existing customers over time. It comes in two flavors: Gross Revenue Retention (GRR), which excludes upsells, and Net Revenue Retention (NRR), which includes expansion revenue from upgrades and add-ons.
This metric matters because it links customer retention directly to revenue performance. High GRR means you’re not losing core revenue; high NRR means you’re not just keeping customers, you’re growing them.
It’s slightly more complex to track, especially in subscription businesses with variable billing. Most billing platforms and revenue analytics tools support this metric, though it may require cohort or customer-level tracking.
Here are the formulas:
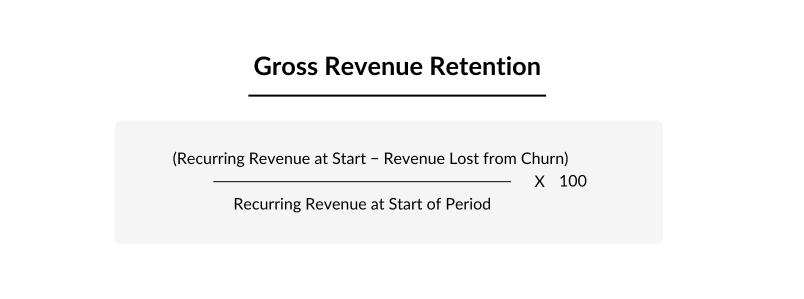
Gross Revenue Retention (GRR):
GRR=(Recurring Revenue at Start of Period−Revenue Lost from Churn/Recurring Revenue at Start of Period)×100
Net Revenue Retention (NRR):
NRR=(Recurring Revenue at Start+Expansion Revenue−Churned Revenue/Recurring Revenue at Start)×100
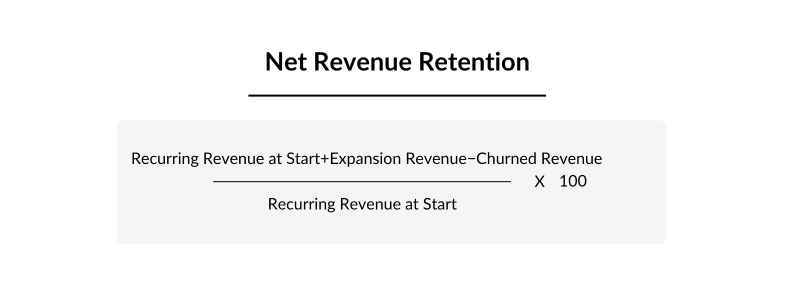
SaaS companies with NRR over 100% are typically growing without needing to rely heavily on new customer acquisition, which is a huge competitive advantage.
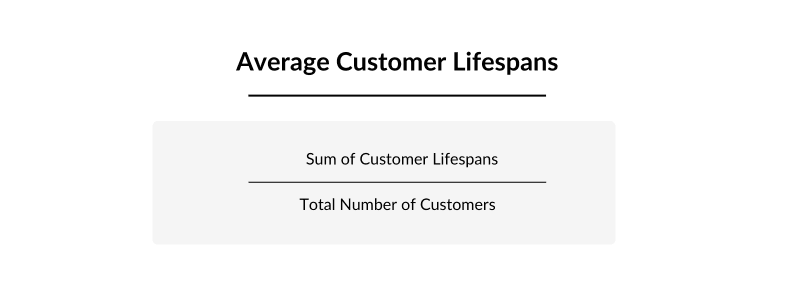
12. Average Customer Lifespan
Average Customer Lifespan tells you how long, on average, a customer stays with your business before churning. It’s a foundational metric that plays directly into calculations like Customer Lifetime Value and helps set expectations for retention performance.
This metric is valuable because it helps you understand the pace of churn over time. A short average lifespan could mean you’re losing people too early, possibly due to onboarding friction, unclear value, or unmet expectations.
It’s relatively easy to calculate if you have historical customer data and timestamps on when they joined and left. Subscription and CRM platforms often include this metric or make it easy to export and compute.
Here’s a simple formula:
Average Customer Lifespan=Sum of Customer Lifespans/Total Number of Customers
If you don’t have exact churn dates, you can also approximate it using:
Average Customer Lifespan=1/Churn Rate
Longer isn’t always better, but consistency matters. Understanding how long customers typically stick around gives you a solid baseline for improving retention efforts.
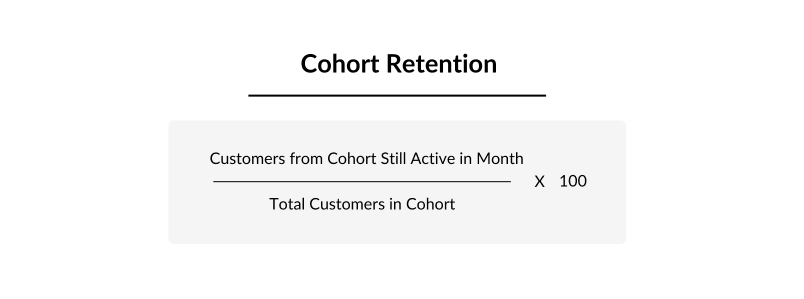
13. Cohort Retention
Cohort Retention tracks how groups of customers (or "cohorts") behave over time based on a shared starting point. This can be the month they signed up, the campaign they came from, or the feature they first used. Instead of looking at overall averages, it shows how retention trends vary across different segments.
This metric is incredibly useful because it uncovers patterns that broad metrics can hide. For example, you might find that users from one signup channel churn quickly, while another group sticks around much longer, helping you double down on what works.
It’s a bit more complex to track manually, but most product analytics platforms offer built-in cohort analysis tools.
There’s no single formula. Cohort retention is typically visualized as a table or chart, where each row represents a cohort and each column shows retention at weekly or monthly intervals.
Here’s how you might calculate a single cohort’s retention rate:
Cohort Retention (Month X)=(Customers from Cohort Still Active in Month X/Total Customers in Cohort)×100
This metric helps you identify not just if customers are churning, but when and which ones, so you can respond with more targeted strategies.
14. Support Ticket Volume Over Time
Support Ticket Volume Over Time tracks how many support requests your customers submit and how that number changes week to week or month to month. It’s not a traditional retention metric, but it can be a powerful signal of customer friction or frustration.
Teams should pay attention to this because a sudden spike in support tickets often points to issues that could lead to churn, like bugs, confusing UX, or unmet expectations. On the flip side, a steady decline (especially among active users) may indicate a smoother experience and better product-market fit.
This metric is easy to track with most helpdesk or support platforms like Zendesk, Intercom, or Freshdesk. You can also segment it by customer tier, product area, or feature to spot patterns faster.
There’s no complex formula here, just track:
Total Support Tickets per Time Period
And optionally:
Ticket Volume per Active User=Total Tickets/Total Active Users
Used alongside other retention metrics, support ticket volume helps you catch problems early before they turn into silent churn.
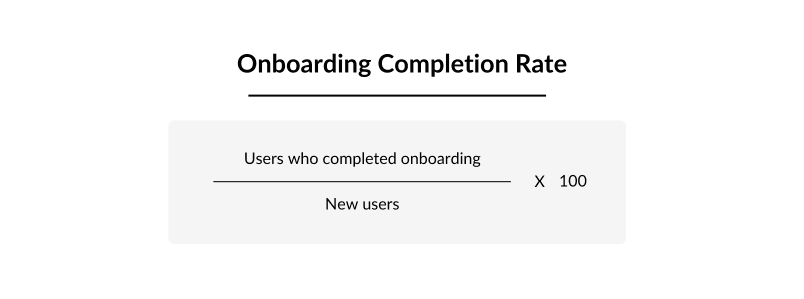
15. Onboarding Completion Rate
Onboarding Completion Rate measures the percentage of new users who complete the key steps in your product-led onboarding flow, whatever “completion” means for your product. It’s one of the clearest early indicators of whether a user is set up for long-term success.
You should track this because poor onboarding is one of the most common reasons users drop off early. If people never reach the point where they understand the value of your product, they’re unlikely to stick around.
It’s fairly easy to track in most product analytics tools once you define your onboarding milestones like completing a setup flow, connecting an integration, or hitting a usage threshold.
Here’s the formula:
Onboarding Completion Rate=(Users Who Completed Onboarding/New Users)×100
Improving this rate often leads to a direct improvement in customer retention, because you’re helping users reach value faster, with less friction.
How to Improve Customer Retention Through Metrics and KPIs
Tracking customer retention metrics is only half the battle. The real value comes from using them to take action.
The goal is to understand what’s driving them and adjust your product, processes, or product strategy accordingly. Here’s how to do that in a way that’s both practical and high-impact.
1. Use cohort retention to uncover when and where users drop off
Cohort analysis shows you when users churn, not just how many do. This is your first line of defense for identifying product-market fit issues, onboarding drop-off points, or weak long-term engagement.
If you notice that Week 1 retention is strong, but Week 4 nosedives, you likely have a mid-funnel engagement problem. That’s your cue to look at what happens during that second and third week, maybe your feature set isn’t sticky enough, or there’s no reason for users to come back.
Actionable move:
Map out engagement events across time per cohort and introduce nudges, feature highlights, or lifecycle emails where drop-off begins. Product teams at Intercom and Notion, for example, use in-app guides during low-engagement windows to re-engage users with new or underused features.
2. Segment retention metrics by behavior, not just by user
Not all churn is created equal. Sometimes your average metrics look fine, but high-value users are slipping away while low-value ones stay. That’s a blind spot.
Actionable move:
Break down retention and churn by user type, plan, activity level, or acquisition source. SaaS companies like Slack often track “power users” as a separate cohort and prioritize their retention efforts, since those users tend to drive both revenue growth and network effects.
3. Monitor product adoption rate and engagement score to predict churn
User retention doesn’t start when a user leaves, it starts the moment they sign up. Low feature adoption and engagement are often early signs that a user won’t stick around.
For example, if users aren’t adopting your core features within the first week, their likelihood of churning skyrockets. A customer may technically be “active” (logging in), but if they’re not getting to the product’s real value, they’re halfway out the door.
Actionable move:
Build an engagement score tied to your key value-driving actions (e.g. connecting an integration, publishing a report, inviting teammates). If users don’t hit those milestones, trigger automated interventions like onboarding prompts, live support offers, or targeted content.
4. Combine CSAT, NPS, and support ticket volume for deeper insight
Satisfaction metrics like CSAT and NPS are often treated as nice-to-have, but when paired with behavioral data, they become powerful predictors.
If a user submits multiple support tickets and gives a low CSAT score, for instance, you’re seeing both frustration and risk. On the flip side, a user with a high NPS score who’s not using advanced features may be a strong candidate for upsell.
Actionable move:
Tag high-risk users (low CSAT, multiple tickets, low feature use) in your CRM and assign them to customer success for proactive outreach. On the other end, use NPS promoters for referrals or case studies, they’re often the least costly retention lever you have.
5. Watch time-between-sessions or time-between-purchases
This metric can quietly tell you when engagement is slipping before the churn happens. Think of it as the “heartbeat” of user activity.
For example, let’s say your average returning user comes back every 3 days. If a subset of users starts returning every 7 days, they’re slowing down and they might stop entirely soon.
Actionable move:
Set thresholds for healthy frequency and use alerts to flag accounts that are drifting. For subscription products, consider auto-triggering check-ins or reminders when usage frequency drops. Prodddy-awarded tools like Mixpanel and Amplitude make this fairly easy to implement.
6. Don’t overlook onboarding metrics, they often predict long-term health
If users don’t complete product-led onboarding, chances are they’ll never fully adopt your product. Retention problems that show up at Month 3 often start on Day 1.
For instance, a fintech app found that users who didn’t link a bank account in the first 2 days had a 70% chance of churning within a month. That single event became the most important onboarding metric they tracked.
Actionable move:
Define what “activation” looks like (not just signup, but value moment) and track onboarding completion rate. If users aren’t getting there, simplify the flow, reduce required inputs, or offer live walkthroughs to close the gap.
7. Use revenue retention to align product and business goals
Net Revenue Retention (NRR) shows whether you’re growing within your existing base. It’s a metric that connects retention to business outcomes and forces teams to think beyond just keeping users around.
Imagine a product-led company noticing flat NRR despite strong user retention. Turns out, customers were retained but not expanding. They adjusted their roadmap to prioritize features that encouraged team invites and deeper usage.
Actionable move:
Pair retention metrics with expansion metrics. Track how retention changes when users adopt add-ons, invite teammates, or cross certain usage thresholds. This gives you a roadmap for product improvements that also move revenue.

How Best Teams Are Improving Customer Retention

Customer retention is about creating the kind of product experience that makes leaving unthinkable. The KPIs you track are levers you can pull to make specific improvements. Done right, each key retention strategy can be directly tied to a metric that tells you whether it’s working.
Improve product onboarding to drive early engagement
Metrics like onboarding completion rate and early activation rate show whether new users are reaching their first “aha” moment. High completion means users see value quickly — low numbers signal friction that needs fixing.Leverage data-driven personalization
Personalization works best when guided by metrics like engagement score, product adoption rate, or feature usage frequency. Data tells you what’s resonating, so you can tailor the experience at scale.Implement proactive customer success
Retention rate, churn rate, and support ticket trends can flag accounts at risk before they leave. Proactive outreach based on these signals turns potential churn into renewed loyalty.Build habit-forming product experiences
Track DAU/MAU ratios, session frequency, and usage streaks to see if your product is becoming part of a user’s routine. If engagement drops, it’s time to introduce triggers, reminders, or new habit loops.Encourage user feedback and close the loop Metrics like Net Promoter Score (NPS) and Customer Satisfaction Score (CSAT) help you understand sentiment — but acting on that feedback is what drives retention. Closing the loop builds trust and keeps customers invested.
Use re-engagement strategies
Inactive user counts, drop in session frequency, and cohort retention curves tell you who’s drifting away. Timely nudges, targeted offers, or content recommendations can pull them back before they churn.Monitor and optimize key retention metrics
Retention is never “set it and forget it.” Review your baseline KPIs — retention rate, churn rate, lifetime value — regularly. Spot trends, test changes, and double down on what works.
Why Customer Retention Metrics Are Your Insider Advantage
Most teams chase growth by looking outward. You know, more traffic, more leads, more signups. But the smartest teams look inward. They ask: What if the real growth is already here, in the customers we’ve already earned?
Customer retention metrics give you that edge. They don’t just report the damage, they show you where the cracks are forming. When you understand what keeps customers coming back (and what silently pushes them away), you stop guessing and start building with intention.
Retention isn’t luck. It’s a pattern. And once you can see the pattern, you can design around it.
FREE Product Analytics Micro-Certification
Are you struggling to translate data into decisions? Become the data-savvy Product Manager every team need with our free micro-certification in Product Analytics.
Enroll Now
Updated: October 16, 2025